
Sometimes you have to weather the sell-off’s and wait for the bounce…here’s an example: It is always tempting to get out when you see red candle after red candle. But if your stop hasn’t hit yet, wait it out, particularly in the case above when you have seven straight red candles on the 30-minute

I bet someone will be wondering how a VP email from Wal-Mart found its way into the media… Apparently the VP stated in his email that sales were the worst he’s seen since working at Wal-Mart seven years ago. Quick Glance at the Market Heat Map and Industries Notables: What was good for materials
One of the most interesting charts I’ve seen in regards to the gun control debate… Quick Glance at the Market Heat Map and Industries Notables: Pockets of strength in Tech among semiconductors. Oil & Gas was on fire today. A lot of weakness in utilities may mean that buyers are moving into more

When patterns like this emerge on the intraday… Be Afraid! (Head & Shoulders Pattern) Quick Glance at the Market Heat Map and Industries Notables: Look at GE go! Banks continue to be the main driver of this market for better or worse. Relative strength in Tech and Materials was much better than


Reversal Indicator Points South When the weakness will come, no one really knows, the key is to be ready when it does come. We have a number of key indicators, the most important of which is the SharePlanner Reversal Indicator which shows that the coming weakness I speak of should occur within the next couple
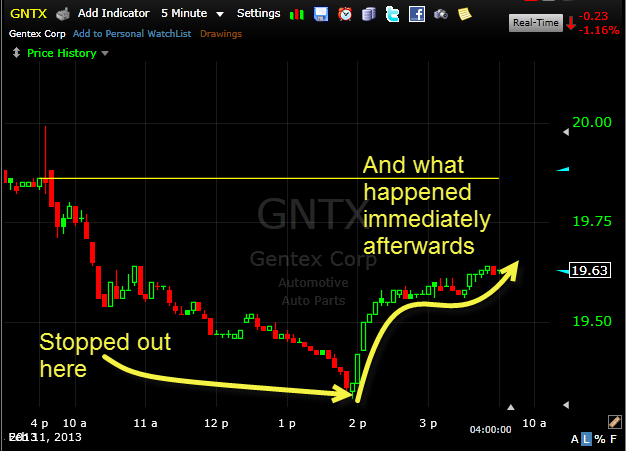
It comes with the territory of trading, but a stop-loss like this really stinks. Quick Glance at the Market Heat Map and Industries Notables: The financials were willing but the market was not. Materials weighed down the market today. Stength found from the tech large-caps. Be sure to check out my latest swing trades

First glimmers of hope in Apple (AAPL) in quite some time. Quick Glance at the Market Heat Map and Industries Notables: Markets made a nice run into the close, clearly buoyed by AAPL and some big names in Consumer Goods. Financials, Materials, and Tech (minus Apple) bled all over the market today. Industrials were

Baby Boomers benefitted more than anyone from the market expansion that started in the 1980’s. Source: Bianco Research Quick Glance at the Market Heat Map and Industries Notables: Technology had weakness among its biggest names. Financials held stronger than the others. Patches of strength in the Industrials Be sure to check out my latest swing

Price Points Upwards; Indicators Point Downwards That’s the mess that the market has traders in right now. For day-traders, the market is much more favorable. For swing-traders such as myself, it is much more difficult to find the right positions and in the right direction. I’m growing slightly more bullish today after we saw the

spc@shareplanner.com
(904) 800-8420
© Copyright 2025 | SharePlanner Inc. All Rights Reserved.
Disclaimer: The information provided on this website is for educational and informational purposes only. Ryan Mallory and/or SharePlanner are not licensed financial advisors, brokers, or tax professionals. The content on this site should not be considered as financial, investment, tax, or legal advice.
All information and opinions expressed herein are based on sources believed to be accurate and reliable. However, we make no representation or warranty as to their accuracy, completeness, or reliability. Any action you take upon the information on this website is strictly at your own risk.
Past performance is not indicative of future results. Investing involves risk, including the possible loss of principal. All investors should make their own decisions based on their specific investment objectives and financial circumstances.
This site may contain links to external websites that are not provided or maintained by or in any way affiliated with Ryan Mallory and/or SharePlanner. Please note that Ryan Mallory and/or SharePlanner do not guarantee the accuracy, relevance, timeliness, or completeness of any information on these external websites.
By using this website, you agree that Ryan Mallory and/or SharePlanner and any affiliated parties are not responsible for any losses or damages resulting from your use of or reliance on the information provided.
It is strongly recommended that you consult with a qualified professional before making any financial decisions.