
The Most Bearish Engulfing Pattern I’ve Ever Seen One of the traders in the chat-room today pointed out a very unique pattern in the SPY that was unfolding, and one that I don’t remember seeing in recent memory. Typically when a stock opens above the previous day’s high price action and closes bellow its
The Chart of the Day… Quick Glance at the Market Heat Map and Industries Notables: Tech and utilities were a drag on the market. Basic Materials also stumbled. Some bright spots in Financials.

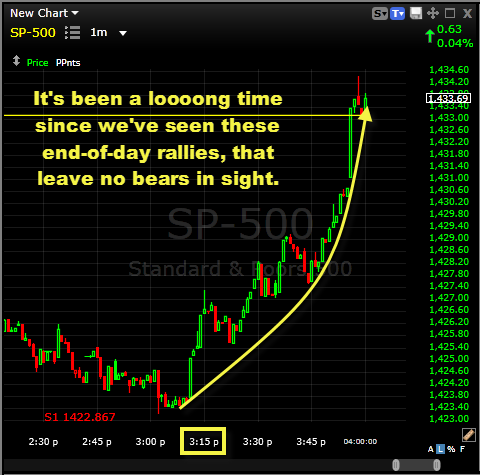
The Chart of the Day… Quick Glance at the Market Heat Map and Industries Notables: That seriously could be the ‘reddest’ map that I’ve seen in a LOOOONG time. Not much else can be said. Everything was awful. You could get a sun burn looking at this heat map for too long.
The Chart of the Day… Trades Made Today: 1. Shorted URBN at 36.32 2. Bought WLT at $39.34 3. Long AGU at $106.23 3. See my past performance as a swing-trader Quick Glance at the Market Heat Map and Industries Notables: Where have you been Apple all these days. If found its sea legs

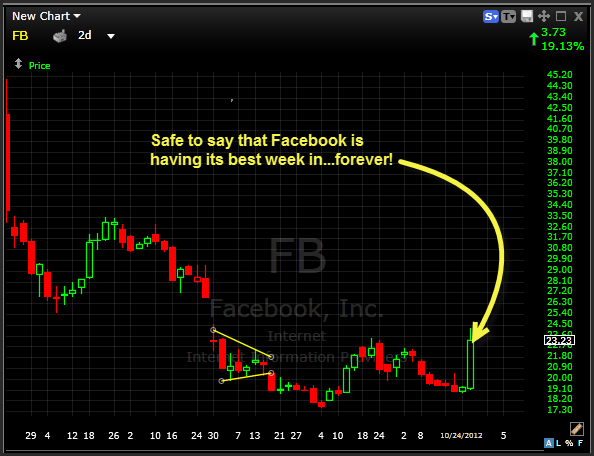
The Chart of the Day… Like I said… a joke… not true support. Trades Made Today: 1. Day-Traded FB for a 0.58% loss from $19.07 to $18.96 2. Shorted EXPD at $35.65. 3. See my past performance as a swing-trader Quick Glance at the Market Heat Map and Industries Notables: What was shaping up
The Chart of the Day… Very cool chart I saw on SocialTrade today. Trades Made Today: 1. 2 Stops today 2. TTI Shorted/covered at $6.14 from $6.06 for a -1.3% loss. 3. Covered DRC at $54.70 from $52.38 for a -4.43% loss. Quick Glance at the Market Heat Map and Industries Notables: Basic Materials, Industrials,

The Chart of the Day… Even in the most bearish of markets, bounces always occur. You have to be weary of them, and make sure, to a fault, that you aren’t increasing your bearishness into the bounce. Trades Made Today: 1. Sold SHLD at $62.17 from $56.15 for a 10.7% gain. 2. Sold LMCA at

The Chart of the Day… Gift-wrapped trades shouldn’t be second-guessed. Trades Made Today: 1. The short above of course. 2. Sold GWW at $215.49 from $210.00 for a 2.6% gain due to earnings coming out in the morning. Quick Glance at the Market Heat Map and Industries Notables: About time Tech made a move higher.

The market had one of its worst weeks in quite some time, and I have to admit, it doesn’t appear to be looking much better according to the SharePlanner Reversal Indicator, which is pointing to further downside to come in equities. Granted there have been a high amount of reversals in recent weeks on the
Trades Made Today: 1. No new positions added today. 2. Closed out AET for a 2.6% gain at 43.22 from $42.12. Quick Glance at the Market Heat Map and Industries Notables: Take a wild guess at who wrecked the party for the bulls today.... (**COUGH**Financials**COUGH**) Tech showed a mild attempt at a rebound. Bigger names

spc@shareplanner.com
(904) 800-8420
© Copyright 2025 | SharePlanner Inc. All Rights Reserved.
Disclaimer: The information provided on this website is for educational and informational purposes only. Ryan Mallory and/or SharePlanner are not licensed financial advisors, brokers, or tax professionals. The content on this site should not be considered as financial, investment, tax, or legal advice.
All information and opinions expressed herein are based on sources believed to be accurate and reliable. However, we make no representation or warranty as to their accuracy, completeness, or reliability. Any action you take upon the information on this website is strictly at your own risk.
Past performance is not indicative of future results. Investing involves risk, including the possible loss of principal. All investors should make their own decisions based on their specific investment objectives and financial circumstances.
This site may contain links to external websites that are not provided or maintained by or in any way affiliated with Ryan Mallory and/or SharePlanner. Please note that Ryan Mallory and/or SharePlanner do not guarantee the accuracy, relevance, timeliness, or completeness of any information on these external websites.
By using this website, you agree that Ryan Mallory and/or SharePlanner and any affiliated parties are not responsible for any losses or damages resulting from your use of or reliance on the information provided.
It is strongly recommended that you consult with a qualified professional before making any financial decisions.