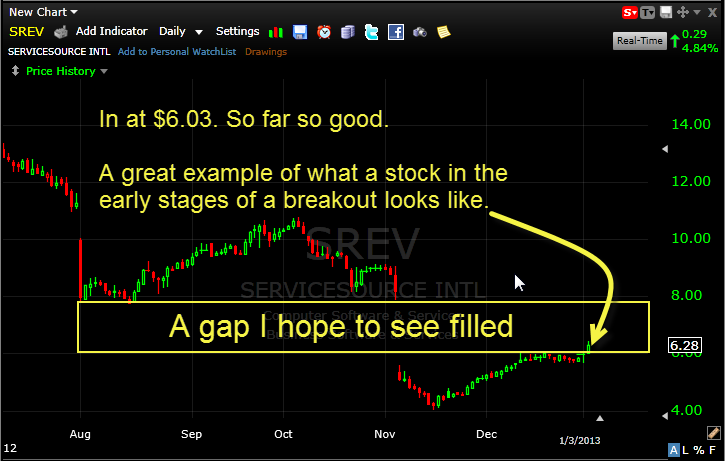
Even the best trading career will have plenty of these missed opportunities Quick Glance at the Market Heat Map and Industries Notables: Technology dragged the market lower. Banks showed notable weakness. Oil & Gas was the lone bright spot for materials. Be sure to check out my latest swing trades and overall past performance
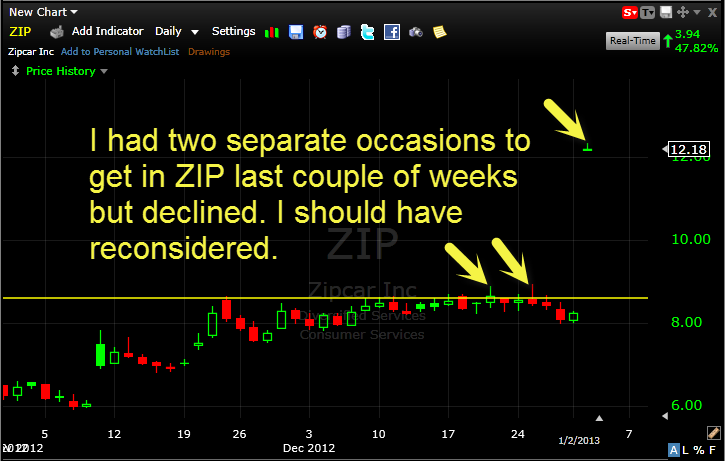
Even the best trading career will have plenty of these missed opportunities Quick Glance at the Market Heat Map and Industries Notables: Same song second verse today. Retail saw some weakness. Banks were unbelievably good today. Be sure to check out my latest swing trades and overall past performance

Reversal Indicator flashes major warning for stocks and the market in general. I know, I know, the market is up some 50 points over the last two trading sessions; we averted sequestration, fiscal cliff crisis, and it should be clear sailing ahead right? Perhaps not. I take very serious what the SharePlanner Reversal signal tells
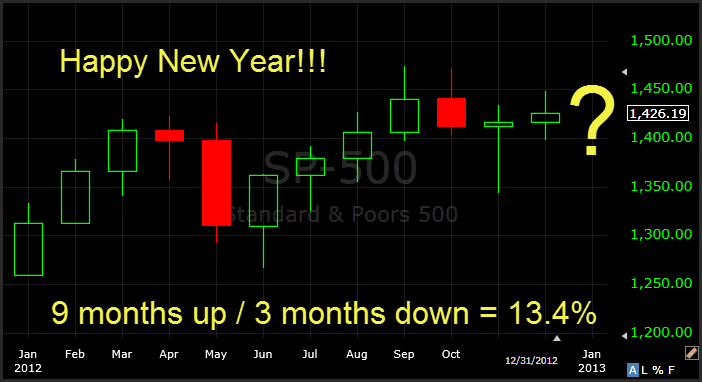
SCS had earnings after the bell yesterday. I didn’t hold my shares through earnings. Quick Glance at the Market Heat Map and Industries Notables: All green to usher in the new year. Unless you’re TLAB or WPI. AAPL paced the market today. Be sure to check out my latest swing trades and
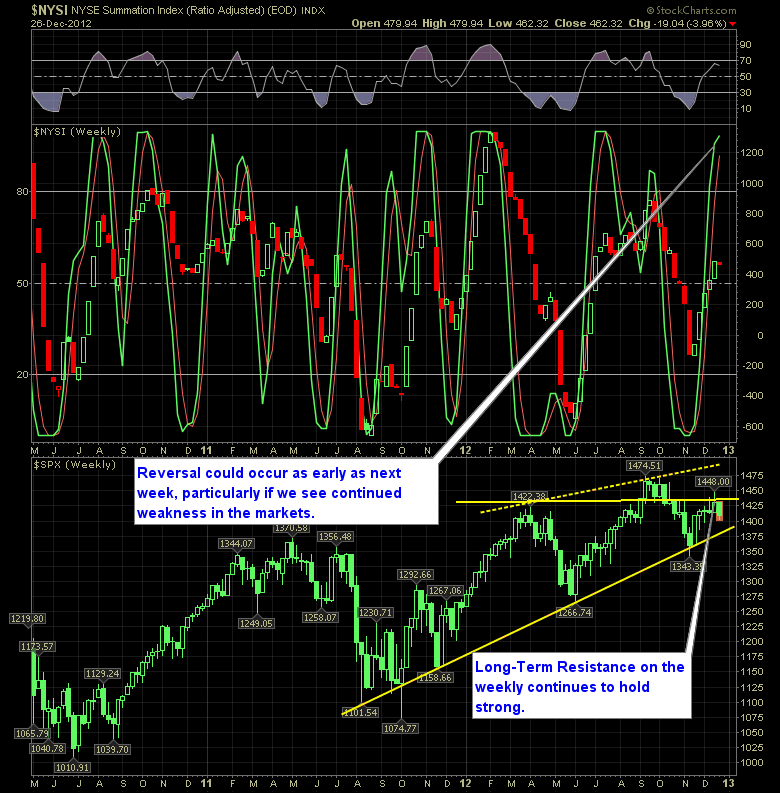
Reversal Indicator shows us going off of the Fiscal Cliff If you have been an observer of the markets, post-Christmas, you’ll know that the selling is continuing to intensify. Perhaps it is a shakeout with the low volume levels Christmas through New Year’s brings – such a thing would be very possible in this environment.

SCS had earnings after the bell yesterday. I didn’t hold my shares through earnings. Quick Glance at the Market Heat Map and Industries Notables: Tech continues to stumble. Banks led the way. Services showed some cracks beneath the surface. Be sure to check out my latest swing trades and overall past performance

It’s important to know the risk of trading the markets outside the bollinger bands. Quick Glance at the Market Heat Map and Industries Notables: The complete opposite from what we saw the last two days. Tech had some patches of green. Consumer goods, services and healthcare led the way lower. Be sure to check
Chart of the Day: The various stages of the flu I’m experiencing right now Quick Glance at the Market Heat Map and Industries Notables: Same song second verse for today’s heat-map. Consumer Goods showed signs of weakness, relatively speaking. Materials were en fuego. Be sure to check out my latest swing trades and overall

Reversal Indicator suggests a strong close to 2012 The bulls got just what it needed yesterday, to keep this market from falling apart on them, and then today you get the upside follow through. So all-in-all, this market looks healthy again, the volume on the pullback was light, and the bulls should continue to be
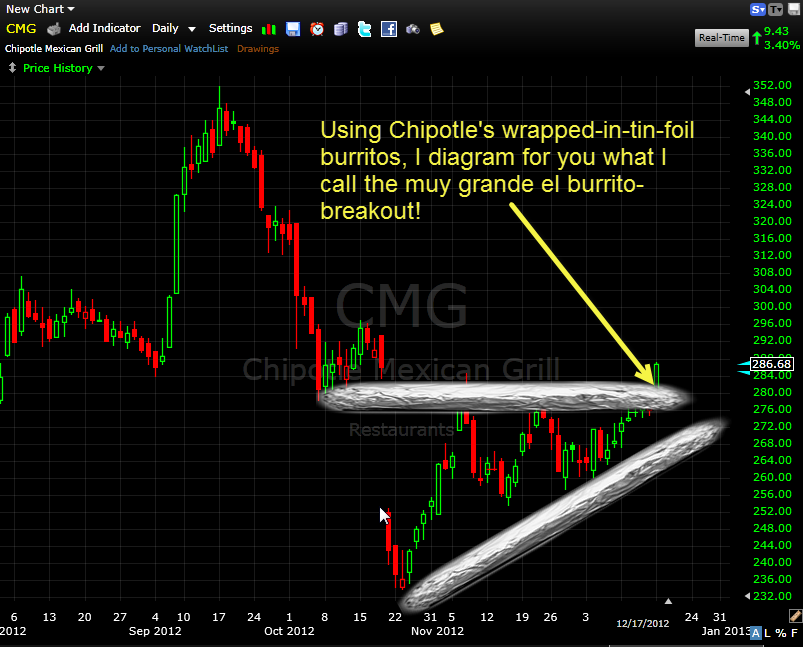
Full on Burrito Breakout – notice how CMG is able to clear heavy burrito resistance. Quick Glance at the Market Heat Map and Industries Notables: Banks led the way. The only glaring area of witness was out of HPQ. Some random weakness in Services. Be sure to check out my latest swing trades and

spc@shareplanner.com
(904) 800-8420
© Copyright 2025 | SharePlanner Inc. All Rights Reserved.
Disclaimer: The information provided on this website is for educational and informational purposes only. Ryan Mallory and/or SharePlanner are not licensed financial advisors, brokers, or tax professionals. The content on this site should not be considered as financial, investment, tax, or legal advice.
All information and opinions expressed herein are based on sources believed to be accurate and reliable. However, we make no representation or warranty as to their accuracy, completeness, or reliability. Any action you take upon the information on this website is strictly at your own risk.
Past performance is not indicative of future results. Investing involves risk, including the possible loss of principal. All investors should make their own decisions based on their specific investment objectives and financial circumstances.
This site may contain links to external websites that are not provided or maintained by or in any way affiliated with Ryan Mallory and/or SharePlanner. Please note that Ryan Mallory and/or SharePlanner do not guarantee the accuracy, relevance, timeliness, or completeness of any information on these external websites.
By using this website, you agree that Ryan Mallory and/or SharePlanner and any affiliated parties are not responsible for any losses or damages resulting from your use of or reliance on the information provided.
It is strongly recommended that you consult with a qualified professional before making any financial decisions.