The Chart of the Day… When Bernanke speaks this is often the resulting effect on the markets Quick Glance at the Market Heat Map and Industries Notables: Banks managed to hold their own fairly well, along with health care. Basic Materials was a Debbie-Downer today. Technology wasn’t far behind it.
The Chart of the Day… When Bernanke speaks this is often the resulting effect on the markets Quick Glance at the Market Heat Map and Industries Notables: Banks managed to hold their own fairly well, along with health care. Basic Materials was a Debbie-Downer today. Technology wasn’t far behind it.

The Chart of the Day… What it looks like when a dead cat bounces. Quick Glance at the Market Heat Map and Industries Notables: No surprise Utilities lagged. No one wants them when things are nice and rosey. No glaring weaknesses. Banks and Apple did incredibly well today.

The Chart of the Day… From SocialTrade.com Quick Glance at the Market Heat Map and Industries Notables: A lot of underlying strength in the market showing that this market is ready for a bounce. Technology struggled which is becoming quite the norm. Financials, Healthcare, and Consumer Goods were right where they needed to

The Chart of the Day… Quick Glance at the Market Heat Map and Industries Notables: Utilities back to the selling ways. Banks showed a lot of strength. Apple still a glaring weakness in the S&P.

The Chart of the Day… Quick Glance at the Market Heat Map and Industries Notables: This specific heat-map color arrangement seems to becoming far too regular on the Evening Tape. The three industries you don’t want to see lead to the downside: Financials, Materials, and Technology all led to the downside today.
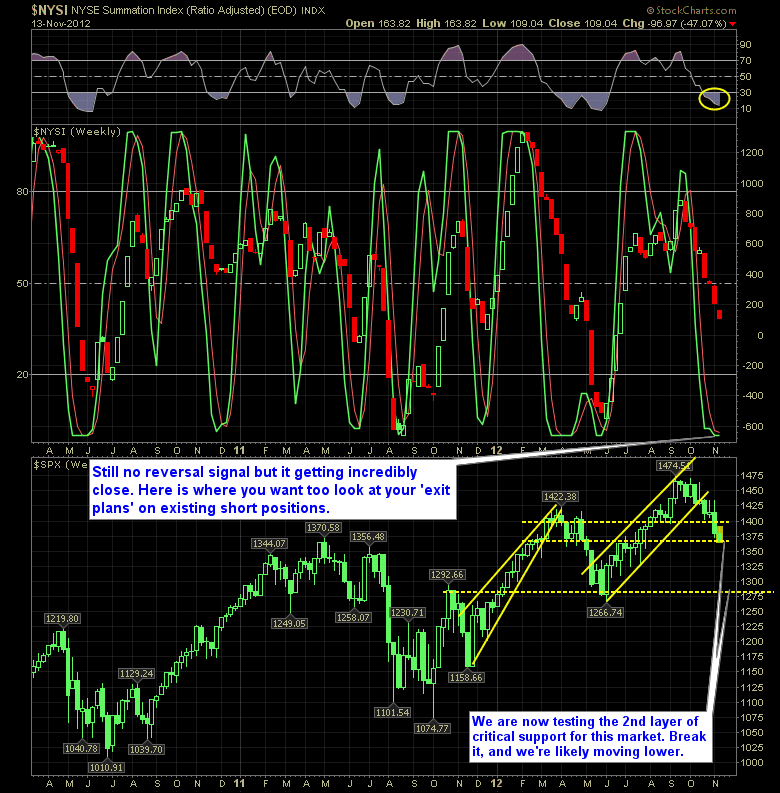
SharePlanner Reversal Indicator – close but no cigar! Last four days have proved frustrating for the bulls and bears a like, as we continue to see rapid sell-offs, bounces, and intra-day reversals throughout the day. On the SPRI, we are finally starting to see signs of a bearish market that is becoming somewhat exhausted. But
The Chart of the Day… Quick Glance at the Market Heat Map and Industries Notables: Financials looks very red – not a good sign for the market. Utilities finally stabilized for the first time in a while. Technology and Materials were hit hard today too.

The Chart of the Day… Quick Glance at the Market Heat Map and Industries Notables: Utilties continue to struggle day-after-day. Basic Materials was mute Scattered weakness in Tech.

The Chart of the Day… Quick Glance at the Market Heat Map and Industries Notables: AAPL shareholders can breath a sigh of relief… today at least. Utilities still trading in the dog-house. Tech was really the only industry that showed any semblance of strength.

spc@shareplanner.com
(904) 800-8420
© Copyright 2025 | SharePlanner Inc. All Rights Reserved.
Disclaimer: The information provided on this website is for educational and informational purposes only. Ryan Mallory and/or SharePlanner are not licensed financial advisors, brokers, or tax professionals. The content on this site should not be considered as financial, investment, tax, or legal advice.
All information and opinions expressed herein are based on sources believed to be accurate and reliable. However, we make no representation or warranty as to their accuracy, completeness, or reliability. Any action you take upon the information on this website is strictly at your own risk.
Past performance is not indicative of future results. Investing involves risk, including the possible loss of principal. All investors should make their own decisions based on their specific investment objectives and financial circumstances.
This site may contain links to external websites that are not provided or maintained by or in any way affiliated with Ryan Mallory and/or SharePlanner. Please note that Ryan Mallory and/or SharePlanner do not guarantee the accuracy, relevance, timeliness, or completeness of any information on these external websites.
By using this website, you agree that Ryan Mallory and/or SharePlanner and any affiliated parties are not responsible for any losses or damages resulting from your use of or reliance on the information provided.
It is strongly recommended that you consult with a qualified professional before making any financial decisions.