
The Chart of the Day… Trades Made Today: 1. Bought GFA at $4.48 2. Shorted ACTV at $12.17 3. Shorted INVN at $12.14 Quick Glance at the Market Heat Map and Industries Notables: Quirky day – Technology still lagging But Financials and Basic Material led the way – which is typically very bullish. Consumer
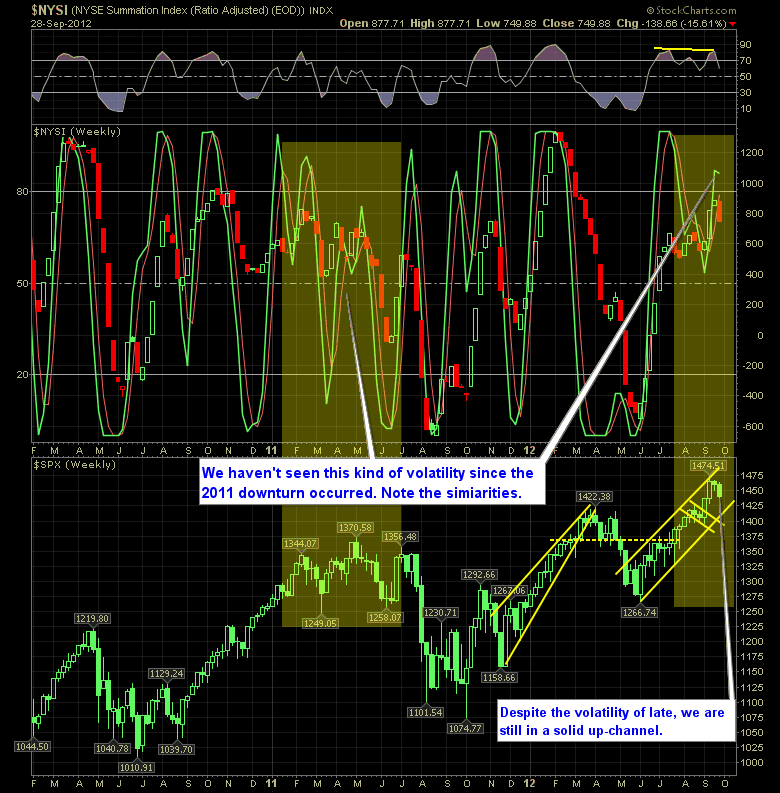
Despite the unexpected twists & turns from the SharePlanner Reversal Indicator of late, it is important to note that this kind of volatility hasn’t happened since the 2011 topping process that led to a huge sell-off in equities. Perhaps this is another early warning sign like 2011 that began forming the topping process to a
The Chart of the Day… A back drop against an Apple chart of the shipments flooding FedEx is enough to bridge the gap between fundamental and technical analysis Quick Glance at the Market Heat Map and Industries Notables: Technology and Basic Materials dragged the market lower today. Utilities and Health Care were flights to safety
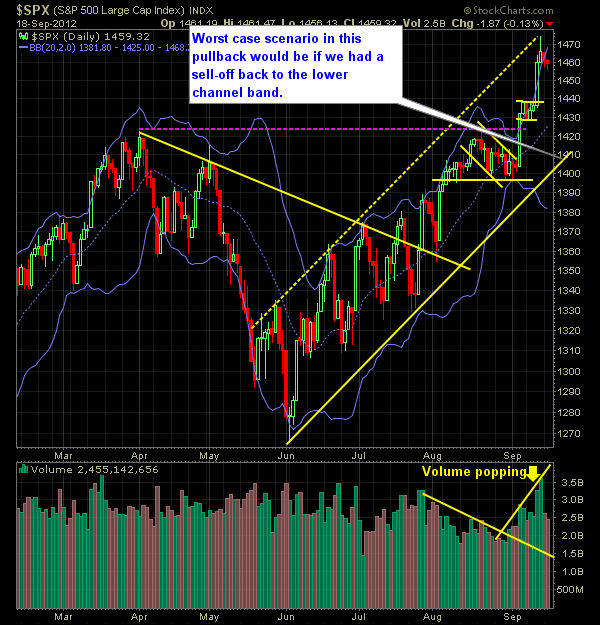
Nothing short of a dull week, the market did absolutely nothing after having a breakout the week prior that completely changed the tone of the market in the bull’s favor. So with about five days of consolidation behind us, it would be logical to surmise that we are likely to see a move in the

The Chart of the Day… Not the first time nor the last time this will happen. Still made 4.3% on the trade. Quick Glance at the Market Heat Map and Industries Notables: Spots of weakness in each of the sectors. Oil showing some signs of bottoming. Financials though still having a rough go of it
The Chart of the Day… Not trying to be political here… but geez…in trading terms we’d call that a “Sell-Off”. Quick Glance at the Market Heat Map and Industries Notables: Technology still having a rough go of it. Financials led the way downward. Oil improved from recent days, but need to see more strength from

The Chart of the Day… Quick Glance at the Market Heat Map and Industries Notables: If this market is going to recover, then you can’t have the entire oil industries stinking it up. One too many leaders in Tech struggling today – like oil, this needs to change. Financials looked better today, and Services
Pre-market update (updated 8:30am eastern): European markets are trading 0.2% higher. Asian markets finished 1.0% higher on the day. US futures are trading slightly above break-even. Economic reports due out (all times are eastern): MBA Purchase Applications (7am), Housing Starts (8:30am), Existing Home Sales (10am), EIA Petroleum STatus Report (10:30am) Technical Outlook (SPX): Day

The Chart of the Day… This comes from yesterday’s market action, but I still wanted to show you this incredible action on the 1-minute chart and how quickly the commodity dropped. It also shows the importance for stop-losses at all times. Quick Glance at the Market Heat Map and Industries Notables: Some of

spc@shareplanner.com
(904) 800-8420
© Copyright 2025 | SharePlanner Inc. All Rights Reserved.
Disclaimer: The information provided on this website is for educational and informational purposes only. Ryan Mallory and/or SharePlanner are not licensed financial advisors, brokers, or tax professionals. The content on this site should not be considered as financial, investment, tax, or legal advice.
All information and opinions expressed herein are based on sources believed to be accurate and reliable. However, we make no representation or warranty as to their accuracy, completeness, or reliability. Any action you take upon the information on this website is strictly at your own risk.
Past performance is not indicative of future results. Investing involves risk, including the possible loss of principal. All investors should make their own decisions based on their specific investment objectives and financial circumstances.
This site may contain links to external websites that are not provided or maintained by or in any way affiliated with Ryan Mallory and/or SharePlanner. Please note that Ryan Mallory and/or SharePlanner do not guarantee the accuracy, relevance, timeliness, or completeness of any information on these external websites.
By using this website, you agree that Ryan Mallory and/or SharePlanner and any affiliated parties are not responsible for any losses or damages resulting from your use of or reliance on the information provided.
It is strongly recommended that you consult with a qualified professional before making any financial decisions.