Stock Market is on shaky ground here. Direction is Uncertain. So lets take a deeper look at the sectors themselves. Which ones are most favorable and the ones that are not.
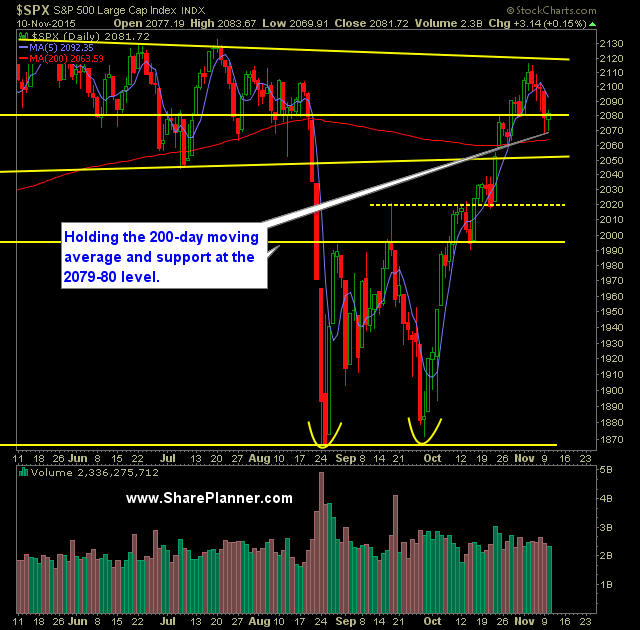
Market’s have rebounded well since the sell-off that led to a test of SPX 200-day moving average. Following today’s CPI report in the pre-market, and the subsequent sell-off, I was ready for the market to begin its selling yet again, so I raised my stops to protect all profits.
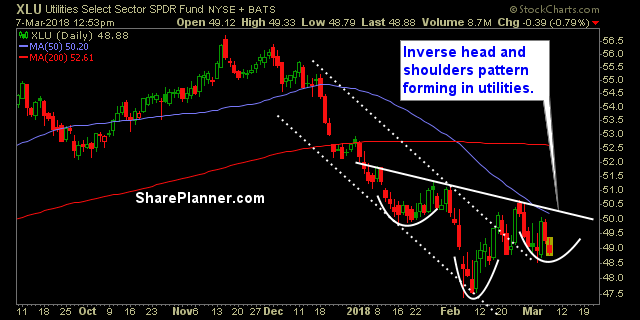
Beyond the technical analysis of the overall market, it is critically important to keep tabs on each sector, to know where the strength lies. For instance, had you invested in utilities over the past two months, you would be down royally, on your trade, while the rest of the market rallied. The same could be

Finding the Best ETFs for Trading Exchange Traded Funds (ETFs) are all the rage these days. Traders are always on the hunt for the latest and greatest ETFs and what is the best ETF to trade on a day-to-day basis. ETFs come in all shapes and sizes and each day it seems like there is

Technical Outlook: Yesterday marked an extremely boring an inconsequential day of trading In the final hour of trading, SPX gave up all of its gains on the day and finished nearly flat. The big concern for me on the chart is that there is now a very obvious head and shoulders pattern that is forming
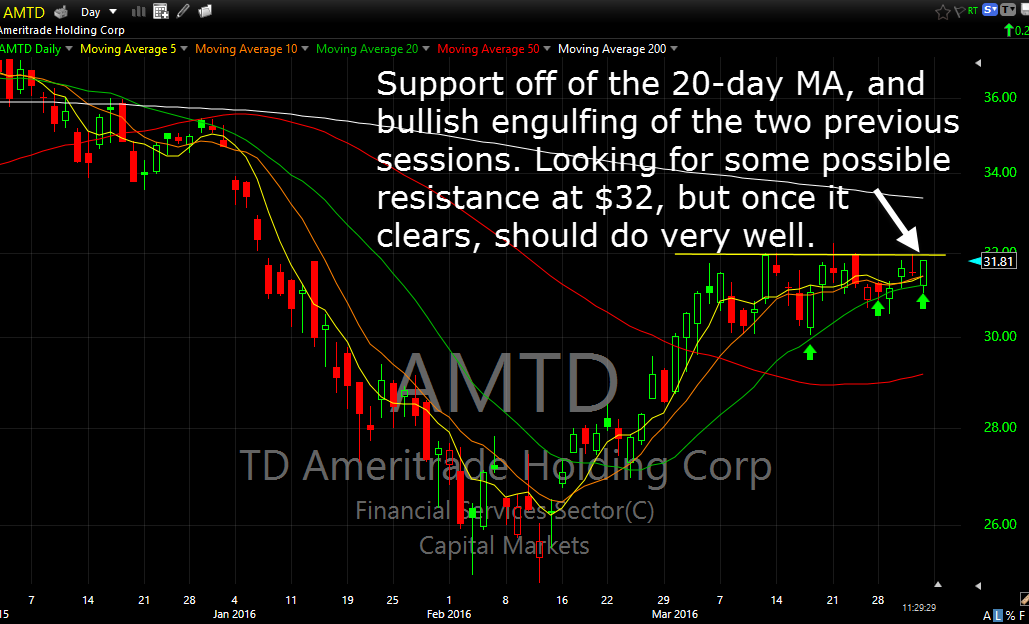
4/1: XLF showing signs of wanting to bounce off of the 20-day moving average, as is AMTD. As a result, I want to trade AMTD now while the risk/reward is favorable and the market is moving off of the lows of the day. once it clears $32, it should be clear sailing.
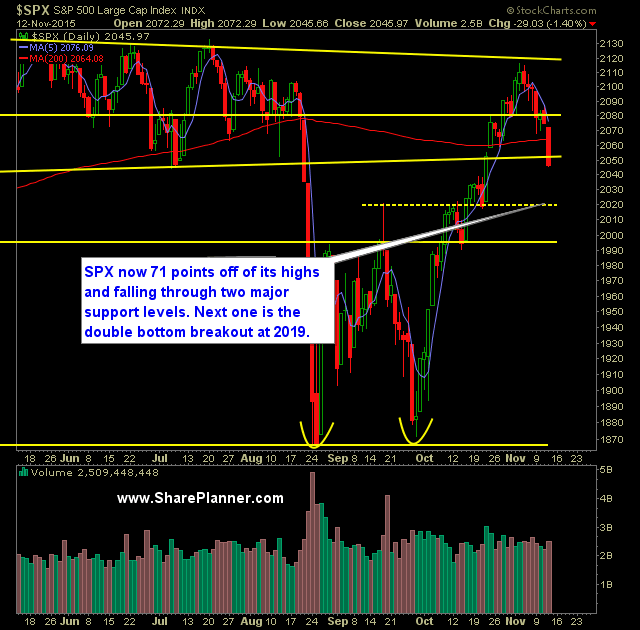
Technical Outlook: SPX had its strongest sell-off since the summer sell-off ended back in late October by dropping 1.4% yesterday. The 200-day moving average offered little to no support yesterday as price action sliced right through it. The Fibonacci retracements suggests a pullback to the 38.2% level at 2023 on SPX Head and shoulders pattern

Technical Outlook: SPX down in the pre market following some comments out of Bullard that was perceived as being hawkish, and of course bearish for the market and stocks. The 200-day moving average is the key level to watch here today. The 20-day moving average will be broken immediately at the market open. I am
Technical Outlook: SPX managed to put a stop to the four-day sell-off yesterday and rally off of the 20-day and 200-day moving averages a slight bit. SPY volume dropped off again and was well below average. The price action of the last five trading days, despite four of them finishing lower, does not

Technical Outlook: Significant pullback that saw price on SPX pull back 1% yesterday . The converged 20 and 200-day moving averages will be a key testing point for the bulls today should the sell-off continue for a fifth straight day. Volume on SPY increased for a second straight day yesterday and came in

spc@shareplanner.com
(904) 800-8420
© Copyright 2025 | SharePlanner Inc. All Rights Reserved.
Disclaimer: The information provided on this website is for educational and informational purposes only. Ryan Mallory and/or SharePlanner are not licensed financial advisors, brokers, or tax professionals. The content on this site should not be considered as financial, investment, tax, or legal advice.
All information and opinions expressed herein are based on sources believed to be accurate and reliable. However, we make no representation or warranty as to their accuracy, completeness, or reliability. Any action you take upon the information on this website is strictly at your own risk.
Past performance is not indicative of future results. Investing involves risk, including the possible loss of principal. All investors should make their own decisions based on their specific investment objectives and financial circumstances.
This site may contain links to external websites that are not provided or maintained by or in any way affiliated with Ryan Mallory and/or SharePlanner. Please note that Ryan Mallory and/or SharePlanner do not guarantee the accuracy, relevance, timeliness, or completeness of any information on these external websites.
By using this website, you agree that Ryan Mallory and/or SharePlanner and any affiliated parties are not responsible for any losses or damages resulting from your use of or reliance on the information provided.
It is strongly recommended that you consult with a qualified professional before making any financial decisions.