

Technical Analysis:
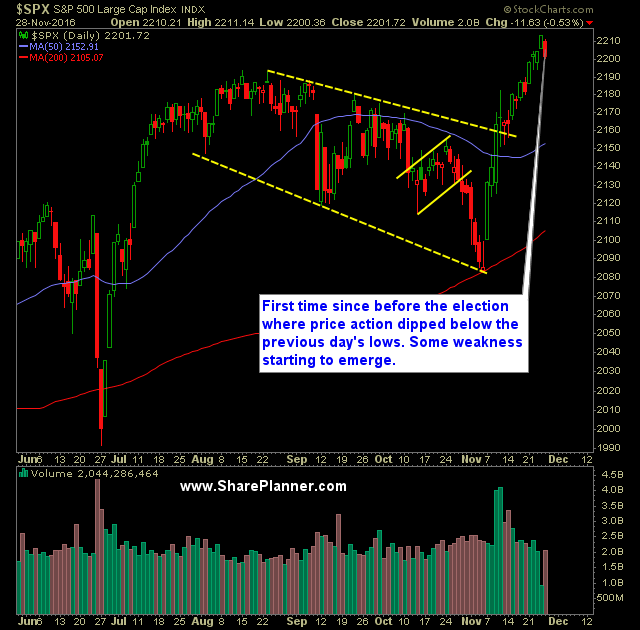
- Price action yesterday on S&P 500 (SPX) broke below the previous day’s trading action for the first time since 11/4 when the market capped off a 9-day losing streak.
- Also of note, for the first time since the Monday before the election, SPX dropped below, and closed below its 5-day moving average.
- Russell 2000 (RUT) saw its 15-day winning streak (yes, 15-days!) snapped following a steep decline yesterday.
- Uptick in volume from what we saw during the Thanksgiving holiday week on SPDRs S&P 500 (SPY), though slightly below recent averages still.
- Price action among equities yesterday was much more bearish than what the market eluded to. There was plenty of profit taking unfolding beneath the surface.
- T2108 (% of stocks trading below their 40-day moving averages) dropped nearly 5% down to 65% and its biggest one-day loss since November 2nd.
- CBOE Market Volatility Index (VIX) popped 6.5% and move out of a 3-day range it had been previously stuck in.
- Heavily overbought on all indices and all time frames, it would not surprise me to see equities begin the process of digesting the recent move and experience some profit taking.
- Weakness in Oil (/CL) looks to continue into today with crude down over -3.5% heading into the open on waning hopes for a deal to be achieved by the OPEC nations. Look for a challenge again of the November lows.
- With the election behind us, the market should start to turn its attention to the Federal Reserve and the eventual rate hike that will come on December 14th when the next FOMC statement is released.
- If it is anything like last December, it should create some jitters in the market as well as a potential selling catalyst that leads to a significant sell-off.
My Trades:
- Sold BAC yesterday at $20.36 for a 1.5% profit
- Sold NOW yesterday at 85.41 for a 2.8% loss.
- Added two new short positions to the portfolio yesterday.
- I will look to add 1-2 new swing-trades to the portfolio today, depending on the direction that the market decides to take today.
- I am currently 20% Long / 20% Short / 60% Cash
Chart for SPX:


Welcome to Swing Trading the Stock Market Podcast!
I want you to become a better trader, and you know what? You absolutely can!
Commit these three rules to memory and to your trading:
#1: Manage the RISK ALWAYS!
#2: Keep the Losses Small
#3: Do #1 & #2 and the profits will take care of themselves.
That’s right, successful swing-trading is about managing the risk, and with Swing Trading the Stock Market podcast, I encourage you to email me (ryan@shareplanner.com) your questions, and there’s a good chance I’ll make a future podcast out of your stock market related question.
In this podcast episode, Ryan discusses how really bad, losing trades in the stock market creates an impossible scenario for the trader in terms of what the right decision should be.
Be sure to check out my Swing-Trading offering through SharePlanner that goes hand-in-hand with my podcast, offering all of the research, charts and technical analysis on the stock market and individual stocks, not to mention my personal watch-lists, reviews and regular updates on the most popular stocks, including the all-important big tech stocks. Check it out now at: https://www.shareplanner.com/premium-plans
📈 START SWING-TRADING WITH ME! 📈
Click here to subscribe: https://shareplanner.com/tradingblock
— — — — — — — — —
💻 STOCK MARKET TRAINING COURSES 💻
Click here for all of my training courses: https://www.shareplanner.com/trading-academy
– The A-Z of the Self-Made Trader –https://www.shareplanner.com/the-a-z-of-the-self-made-trader
– The Winning Watch-List — https://www.shareplanner.com/winning-watchlist
– Patterns to Profits — https://www.shareplanner.com/patterns-to-profits
– Get 1-on-1 Coaching — https://www.shareplanner.com/coaching
— — — — — — — — —
❤️ SUBSCRIBE TO MY YOUTUBE CHANNEL 📺
Click here to subscribe: https://www.youtube.com/shareplanner?sub_confirmation=1
🎧 LISTEN TO MY PODCAST 🎵
Click here to listen to my podcast: https://open.spotify.com/show/5Nn7MhTB9HJSyQ0C6bMKXI
— — — — — — — — —
💰 FREE RESOURCES 💰
— — — — — — — — —
🛠 TOOLS OF THE TRADE 🛠
Software I use (TC2000): https://bit.ly/2HBdnBm
— — — — — — — — —
📱 FOLLOW SHAREPLANNER ON SOCIAL MEDIA 📱
FACEBOOK: https://facebook.com/shareplanner
*Disclaimer: Ryan Mallory is not a financial adviser and this podcast is for entertainment purposes only. Consult your financial adviser before making any decisions.
You Might Like

South Korea: The Hidden Driver of US Tech Volatility

Stop Trying to Hit Home Runs: Start Trading Within Your Means

How to Trade Breakouts Without Getting Trapped