
Pre-market update: Asian markets traded -0.5% lower. European markets are trading -0.5% lower. US futures are trading 0.1% lower ahead of the market open. Economic reports due out (all times are eastern): ICSC-Goldman Store Sales (7:45), PPI-FD (8:30), Redbook (8:55), Treasury International Capital (9am) Technical Outlook (SPX): Yesterday’s price action saw the dip buyers come

Pre-market update: Asian markets traded -0.2% higher. European markets are trading flat. US futures are trading 0.1% lower ahead of the market open. Economic reports due out (all times are eastern): Empire State Manufacturing (8:30), Industrial Production (9:15) Technical Outlook (SPX): Friday nullified the notion that the action from the previous two days was an

Pre-market update: Asian markets traded 0.1% higher. European markets are trading flat. US futures are trading 0.1% lower ahead of the market open. Economic reports due out (all times are eastern): Retail Sales (8:30), Import and Export Prices (8:30), Consumer Sentiment (9:55), Business Inventories (10) Technical Outlook (SPX): For a third straight day, SPX tested
Pre-market update: Asian markets traded 0.3% higher. European markets are trading 0.7% lower. US futures are trading 0.4% lower ahead of the market open. Economic reports due out (all times are eastern): Jobless Claims (8:30), Quarterly Services Survey (10), EIA Natural Gas Report (10:30), Treasury Budget (2) Technical Outlook (SPX): SPX tested support at 1887 yet

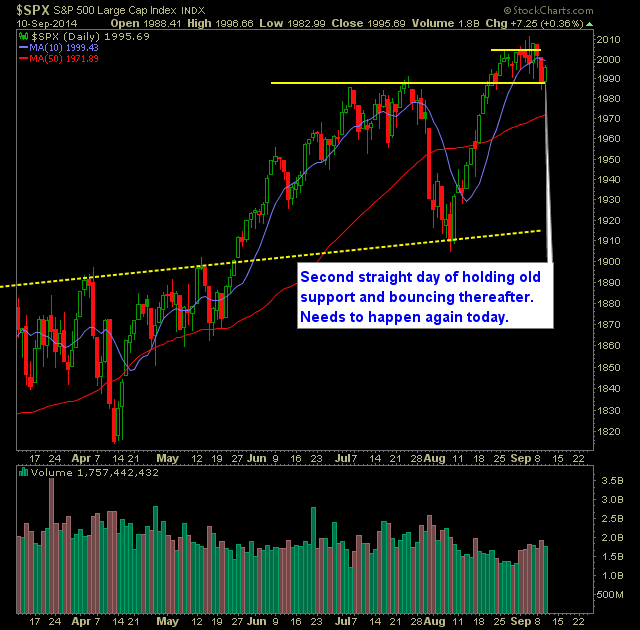
Pre-market update: Asian markets traded 0.4% lower. European markets are trading 0.1% lower. US futures are trading 0.1% lower ahead of the market open. Economic reports due out (all times are eastern): MBA Purchases (7), Wholesale Trade (10), EIA Petroleum Status Report (10:30) Technical Outlook (SPX): SPX broke support at 1990 which represented the lows of

Pre-market update: Asian markets traded 0.1% higher. European markets are trading 0.2% lower. US futures are trading flat ahead of the market open. Economic reports due out (all times are eastern): ICSC Goldman Store Sales (7:45), Redbook (8:55) Technical Outlook (SPX): Disappointing day for SPX yesterday as it failed to hold the breakout level that it
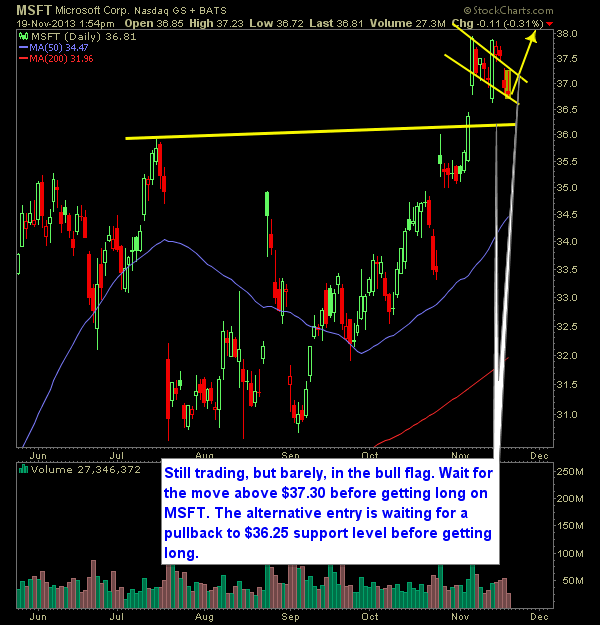
Microsoft (MSFT) is still trading, but barely, in the bull flag that I’ve been outlining for a couple of weeks now. Wait for the move above $37.30 before getting long on MSFT. The alternative entry strategy is to wait for a pullback to the $36.25 support level before getting long. Overall, I consider MSFT

It’s not too often you use the words “Breakout” and “Microsoft” in the same sentence, but that is definitely what we are seeing here today. Microsoft (MSFT) has a strong uptrend already in place and now breaking out above heavy resistance around the $36.50 area. Here’s the Microsoft technical analysis:

Microsoft (MSFT) is at an interesting juncture here. Break through $34 and it will no doubt make a run to $35.20. So far price resistance has been broken through, but the down trend off of the July highs has only been tested…. Stay tuned! Here’s the MSFT technical analysis:

spc@shareplanner.com
(904) 800-8420
© Copyright 2025 | SharePlanner Inc. All Rights Reserved.
Disclaimer: The information provided on this website is for educational and informational purposes only. Ryan Mallory and/or SharePlanner are not licensed financial advisors, brokers, or tax professionals. The content on this site should not be considered as financial, investment, tax, or legal advice.
All information and opinions expressed herein are based on sources believed to be accurate and reliable. However, we make no representation or warranty as to their accuracy, completeness, or reliability. Any action you take upon the information on this website is strictly at your own risk.
Past performance is not indicative of future results. Investing involves risk, including the possible loss of principal. All investors should make their own decisions based on their specific investment objectives and financial circumstances.
This site may contain links to external websites that are not provided or maintained by or in any way affiliated with Ryan Mallory and/or SharePlanner. Please note that Ryan Mallory and/or SharePlanner do not guarantee the accuracy, relevance, timeliness, or completeness of any information on these external websites.
By using this website, you agree that Ryan Mallory and/or SharePlanner and any affiliated parties are not responsible for any losses or damages resulting from your use of or reliance on the information provided.
It is strongly recommended that you consult with a qualified professional before making any financial decisions.