
Pre-market update: European markets are trading 0.5% lower. Asian markets traded 0.7% lower. US futures are trading 0.5% lower. Economic reports due out (all times are eastern): None Technical Outlook (SPX): SPX closed at all-time highs yesterday and broke out of the four-day, 12-point consolidation range it had previously been in. Tech after hours
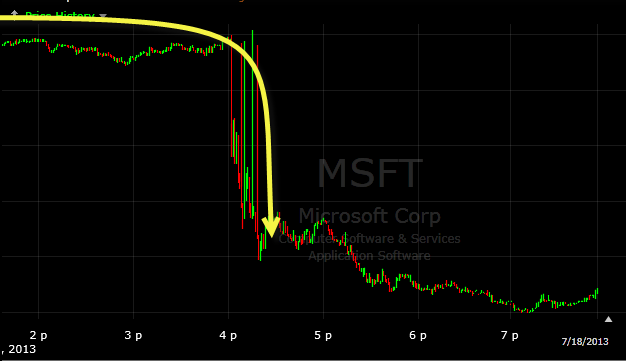
Microsoft (MSFT) and Google (GOOG) get HAMMERED after hours. Quick Glance at the Market Heat Map and Industries Notables: Oh my gosh! Banks were freakin’ phenomenal – where have you been all my life!?! It was like tech knew ahead a time after hours were going to be a disaster. Healthcare wasn’t too far behind
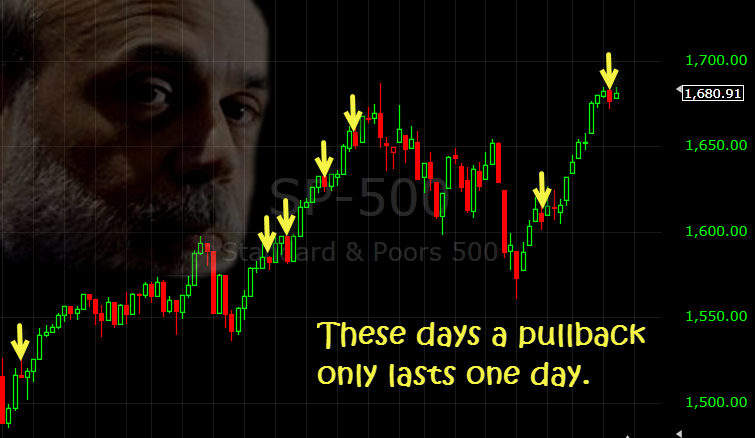
A One Day Pullback…If You’re Lucky Quick Glance at the Market Heat Map and Industries Notables: Yesterday’s weak banks were today’s leaders. Materials made a mild recovery. Technology was weighed down by Microsoft (MSFT) weakness and big tech non-participation. Be sure to check out my latest swing trades and overall past performance
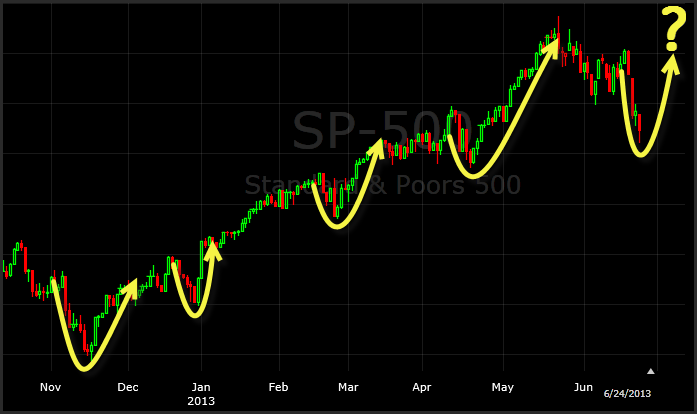
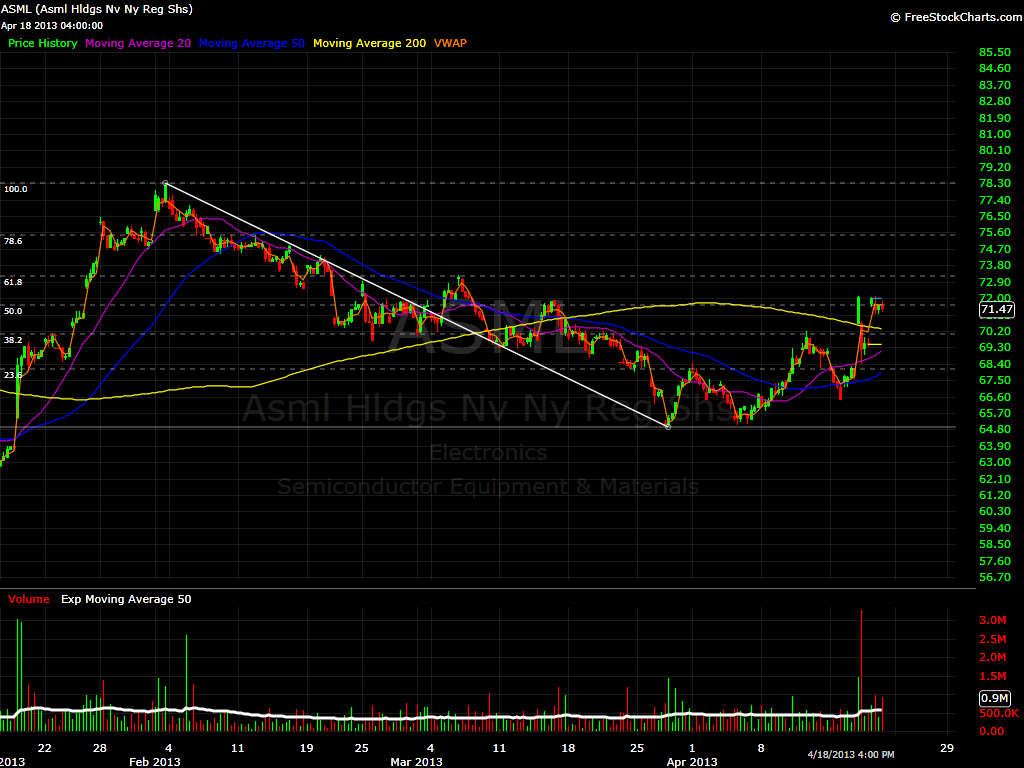
$ASML 2 Hour Chart - Gaping up, but between 2 fib levels, It looks more liekly it will go for the 73.20 target which represents the 61.8% Fibonacci level. If it does, that is usually the turning point. $GOLD 15 min chart - Another one opening in the middle of two Fibonacci levels. I highly

$AAPL 15 Min Chart - I included this short term scalp chart with Fibonacci levels just in case people are looking for an entry on this stock. If it goes over 428.49 (23.6% Fibonacci Level). It is a nice long. $BBRY Daily Chart - No love until 15.52. So stop dreaming with it until then.

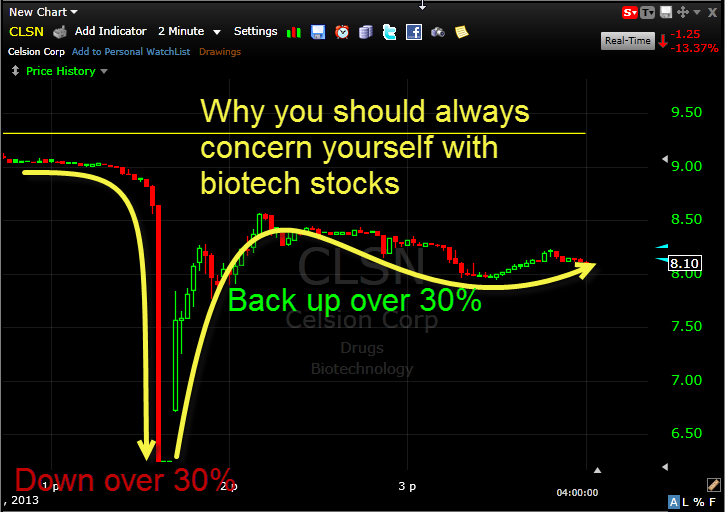
Be weary of cheap-o bio-tech stocks… Quick Glance at the Market Heat Map and Industries Notables: For a market that finished higher today, the only stocks that really looks good were banks, AAPL and HPQ Utilities and Industrials weighed on the market Despite the Nasdaq finishing higher, telecom , GOOG, and
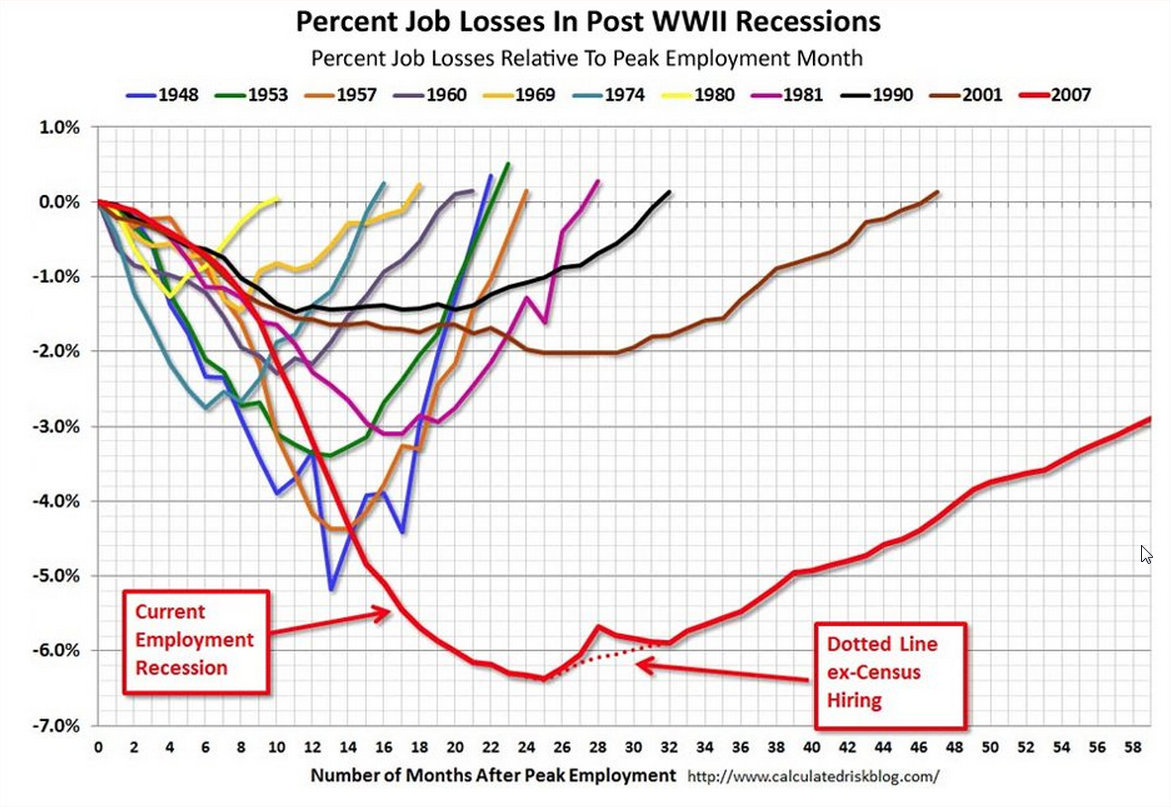
Scariest Employment Chart To Date… Quick Glance at the Market Heat Map and Industries Notables: Apple (AAPL) weighed on tech for a second straight day, as did Microsoft (MSFT). Banks, Utilities, and Materials led the way. Services showed patches of weakness. Be sure to check out my latest swing trades and overall
I recently saw the movie, “Moneyball”, which starred Brad Pitt playing the roll of Billy Beane (General Manager of the Oakland A’s). I must say it was one of the best movies I have seen in years. And there wasn’t even anything that belew up during the two-hour movie. Nonetheless, that movie was riviting, and

spc@shareplanner.com
(904) 800-8420
© Copyright 2025 | SharePlanner Inc. All Rights Reserved.
Disclaimer: The information provided on this website is for educational and informational purposes only. Ryan Mallory and/or SharePlanner are not licensed financial advisors, brokers, or tax professionals. The content on this site should not be considered as financial, investment, tax, or legal advice.
All information and opinions expressed herein are based on sources believed to be accurate and reliable. However, we make no representation or warranty as to their accuracy, completeness, or reliability. Any action you take upon the information on this website is strictly at your own risk.
Past performance is not indicative of future results. Investing involves risk, including the possible loss of principal. All investors should make their own decisions based on their specific investment objectives and financial circumstances.
This site may contain links to external websites that are not provided or maintained by or in any way affiliated with Ryan Mallory and/or SharePlanner. Please note that Ryan Mallory and/or SharePlanner do not guarantee the accuracy, relevance, timeliness, or completeness of any information on these external websites.
By using this website, you agree that Ryan Mallory and/or SharePlanner and any affiliated parties are not responsible for any losses or damages resulting from your use of or reliance on the information provided.
It is strongly recommended that you consult with a qualified professional before making any financial decisions.