
My Trading Past Performance in Review You might not have realized it, but March actually snapped a four month winning streak when the S&P 500 decided to close a whooping 0.92 points lower. In percentage terms that was -0.04% lower for the month. Needless to say there was a lot of chop in the market

In February, my swing trading stock returns were solid across the board The S&P 500, Dow Jones Industrial Average, Nasdaq and Russell Index finished higher than where they they all started the month at and compounded on the gains from January in terms of overall stock market returns.
Commodities have been on an absolute tear since Dec 2008 with a return of around 89% on the CCI over that span. However, this market may finally see a correction. The market just recently tested the March 7th high and has sold off since. It took 7 days from the March swing high down to
July Cotton reached its H&S Top objective today ~ 149.03. It reached this area pretty quickly: over 39 points in just 12 trading days. The reward to risk ratio was a solid one: 2.63 to 1.00. It takes deep pockets to trade this market, but if you have the capital it would've meant risking ~ 7475
ES futures did indeed find support yesterday in my 1285-1300 zone as the low was 1298.25. We got a nice pop off the top end fib support in my earlier chart. Also, just below today’s low was MP and DS2 support. The intraday chart shows RSI divergence (bullish) and the downward sloping trendline was broken. On the
Cotton has moved into July from March. So I will now focus on the July chart. Yesterday we got confirmation of a h&s top with a close below the upward sloping neckline. This patterns target is around 149.05 with an initial stop at 203.30.
There is a possible buy zone shaping up in the Euro. If we can get down to the 1.4075-1.4095 area sometime today I would look to get long with a stop below the most recent pivot low of 1.4041. This area could produce a real nice bounce.
Cotton has been on an impressive up move since mid 2010 appreciating over 150%. However, we are starting to see some signs of a possible H&DS top forming. The chart shows the Left Shoulder, Head, and Right Shoulder have all formed. We are now just waiting for confirmation, which would be a close below the
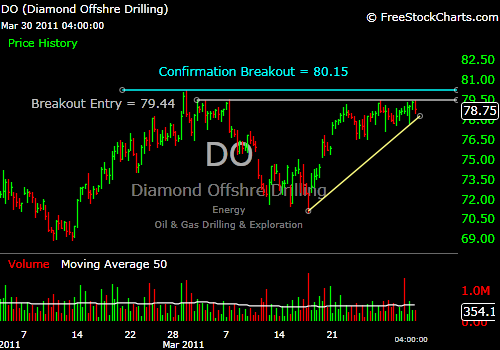
Had a few minutes tonight to some scans and look a few charts. Here are two stocks that I will be keeping a close eye on tomorrow should this unrelenting market melt-up continue. I would normally consider DO ( Diamond Offshore ) as a breakout swing trade, but given the markets current overbought conditions, I
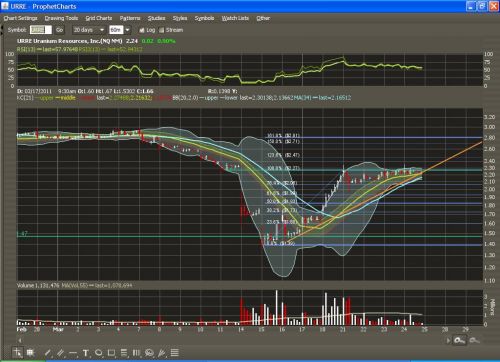
Ok, guys. Here’s my first post on SharePlanner, so I’m going to keep it simple. In the wake of the Japan nuclear scare, I bought into URRE and UEC after they gapped-down. I was counting on this being a knee-jerk overreaction to nuclear power fears, and actually hoped I didn’t sign on too soon. However,

spc@shareplanner.com
(904) 800-8420
© Copyright 2025 | SharePlanner Inc. All Rights Reserved.
Disclaimer: The information provided on this website is for educational and informational purposes only. Ryan Mallory and/or SharePlanner are not licensed financial advisors, brokers, or tax professionals. The content on this site should not be considered as financial, investment, tax, or legal advice.
All information and opinions expressed herein are based on sources believed to be accurate and reliable. However, we make no representation or warranty as to their accuracy, completeness, or reliability. Any action you take upon the information on this website is strictly at your own risk.
Past performance is not indicative of future results. Investing involves risk, including the possible loss of principal. All investors should make their own decisions based on their specific investment objectives and financial circumstances.
This site may contain links to external websites that are not provided or maintained by or in any way affiliated with Ryan Mallory and/or SharePlanner. Please note that Ryan Mallory and/or SharePlanner do not guarantee the accuracy, relevance, timeliness, or completeness of any information on these external websites.
By using this website, you agree that Ryan Mallory and/or SharePlanner and any affiliated parties are not responsible for any losses or damages resulting from your use of or reliance on the information provided.
It is strongly recommended that you consult with a qualified professional before making any financial decisions.