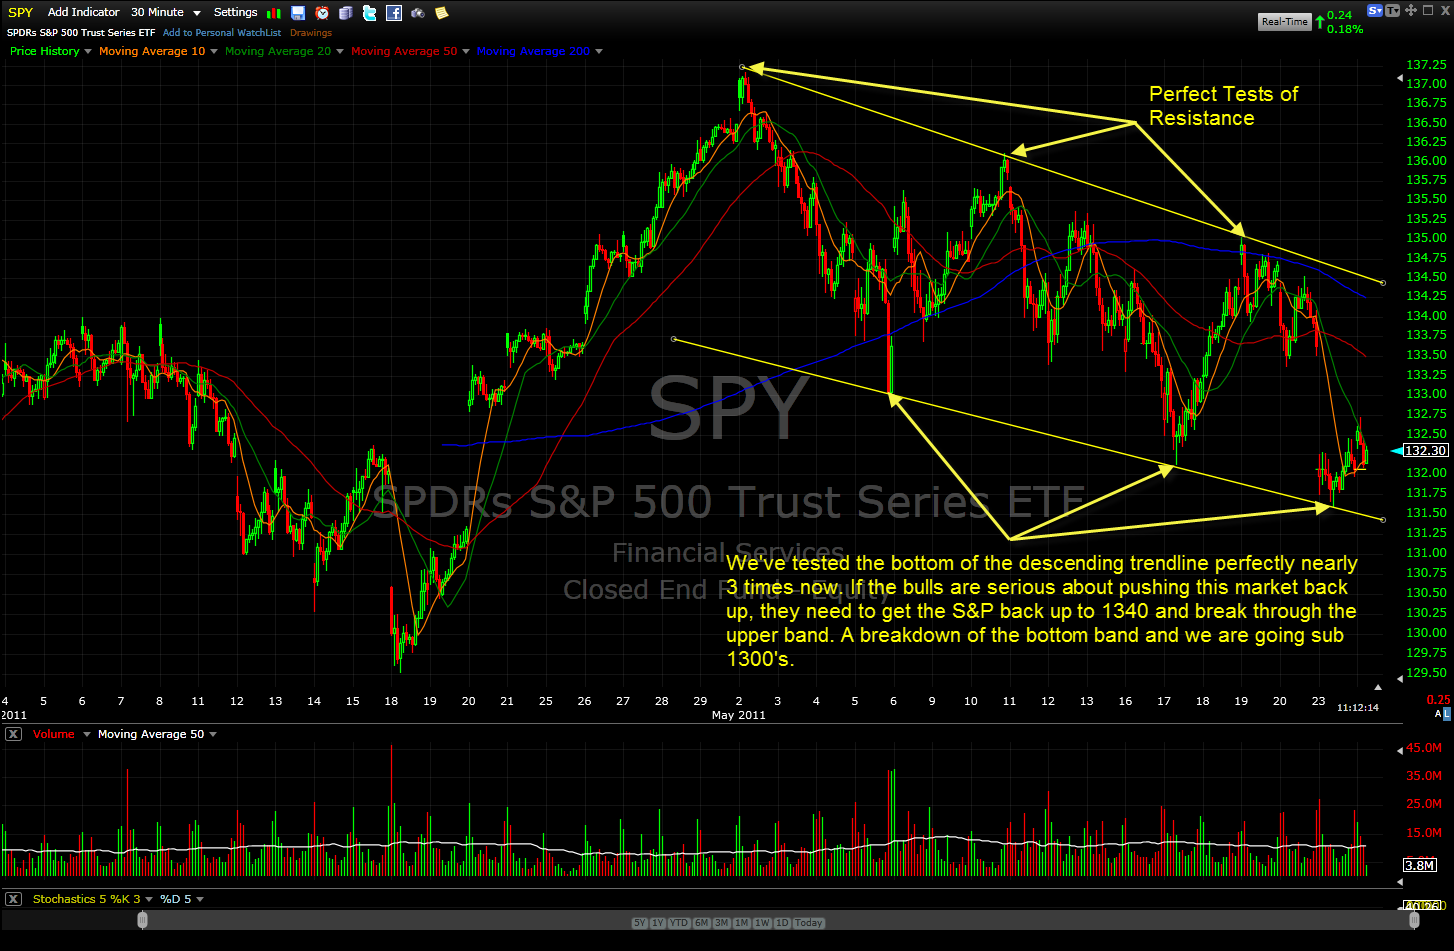
For most of this month the bears have thrown around the bulls like some red-headed, left-handed, step-child. At this point, we are in a steep decending channel, and as it stands right now, we are on the bottom end of that channel, which means for the bears the risk far out weighs the reward, unless
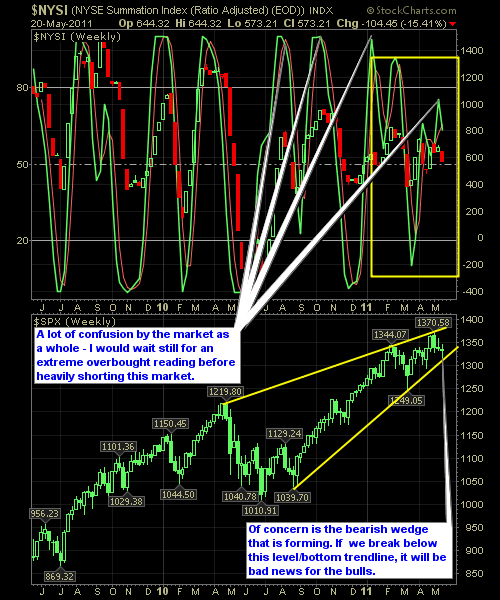
The market continues to leave both the bulls and the bears on the edge of their seats. Direction is unclear at this point, and essentially, the only way to make money in this market is by trading quickly when the opportunity is there, and taking the profits in the same manner. So unless you can
Current Long Positions (stop-losses in parentheses): GOOG (528.75), NFLX June 270 Calls, AAPL (342.25), NTAP (52.45), B (24.64), PEP (69.75), APH (55.20), HPQ (40.65), RSH (15.93), STZ (22.20), CHKP (54.19), SSO (53.35) Current Short Positions (stop-losses in parentheses): None BIAS: 60% Long Economic Reports Due Out (Times are EST): Empire

If you’re like me, you probably expected the NYSE Reversal Indicator to be pointing straight down. Instead, it is the exact opposite. So what does this all mean? Well, let me give you a few observations that come to mind 1) Bears only managed to push the market down last week, by a smidgen, which

All I know is that I shorted silver on Monday, ZSL. I heard all kinds talk about silver and commodities freaking everyone out from CNBC to the blogosphere and twitter. Now, first of all, let me be perfectly clear in that the proceeds from ZSL countered the total error of buying GLUU at absolute tops.
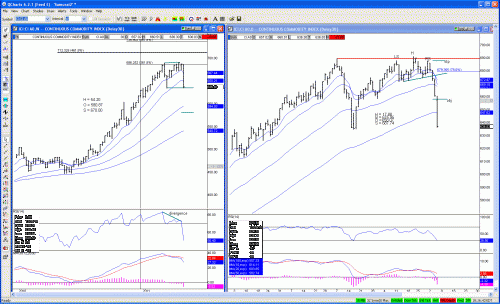
We have seen significant selling the past two days since confirmation of the H&S Top. The objective of 658.07 was reached early today and continued much lower. The weekly chart shows a potential double top formation as well. If we get a close below 635.07 tomorrow it will be confirmed. This would signal even more
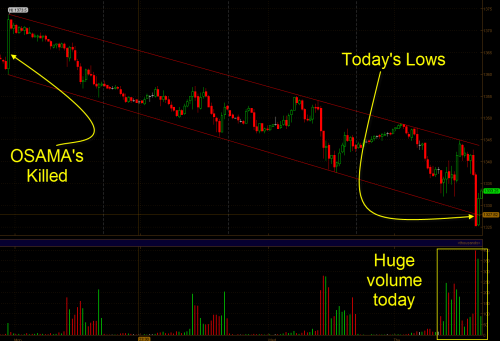
One of the crazier days in the market this year – Oil down a shocking -9%, Silver down another 12%, gold down 3%, and you have on your hands a nasty, nasty day in the market, that was plagued with huge intraday swings. To say the least – I am exhausted after a day like
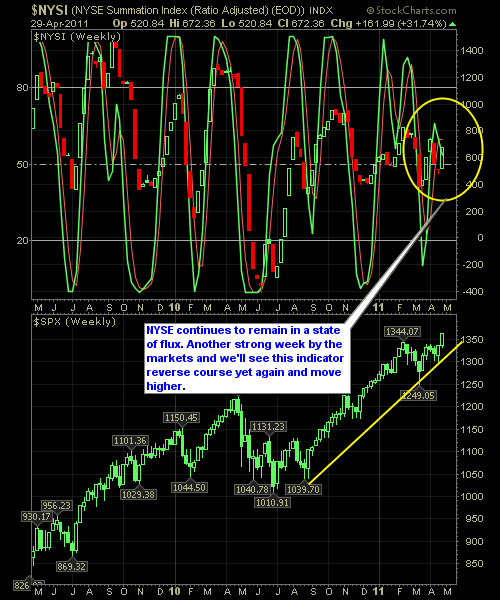
It would be easy to assume that because the indicator is pointing down that we have selling ahead of us. But because the reversal signal is occuring in the middle of the range and not at the extremes, it cannot be trusted. As a result my approach is to continue to trade this market higher,

The market has been all over the place of late, and the NYSE Reversal Indicator is showing exactly as much. There hasn’t been, for the better part of this year any concrete direction that the market is taking and as a result, we get a few good weeks in one direction before quickly reversing course
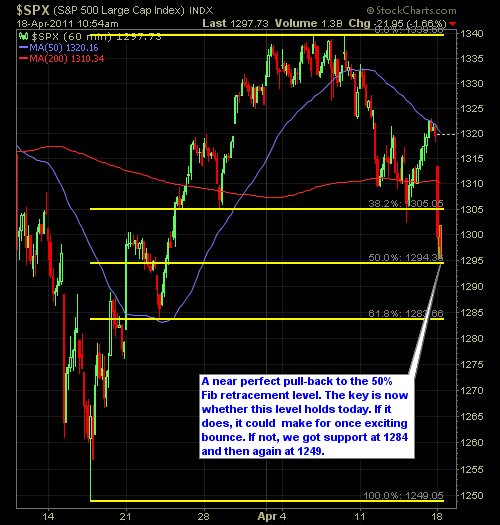
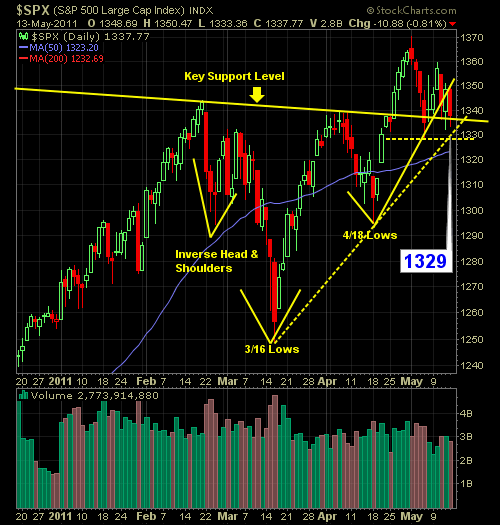
What a way to start the week out. The market was already heading in the wrong direction when the S&P decided to downgrade the debt outlook of the U.S. In any case, I’ve provided below a quick mark up of where daily support levels exist and right now we are currently testing the 50% Fibonacci

spc@shareplanner.com
(904) 800-8420
© Copyright 2025 | SharePlanner Inc. All Rights Reserved.
Disclaimer: The information provided on this website is for educational and informational purposes only. Ryan Mallory and/or SharePlanner are not licensed financial advisors, brokers, or tax professionals. The content on this site should not be considered as financial, investment, tax, or legal advice.
All information and opinions expressed herein are based on sources believed to be accurate and reliable. However, we make no representation or warranty as to their accuracy, completeness, or reliability. Any action you take upon the information on this website is strictly at your own risk.
Past performance is not indicative of future results. Investing involves risk, including the possible loss of principal. All investors should make their own decisions based on their specific investment objectives and financial circumstances.
This site may contain links to external websites that are not provided or maintained by or in any way affiliated with Ryan Mallory and/or SharePlanner. Please note that Ryan Mallory and/or SharePlanner do not guarantee the accuracy, relevance, timeliness, or completeness of any information on these external websites.
By using this website, you agree that Ryan Mallory and/or SharePlanner and any affiliated parties are not responsible for any losses or damages resulting from your use of or reliance on the information provided.
It is strongly recommended that you consult with a qualified professional before making any financial decisions.