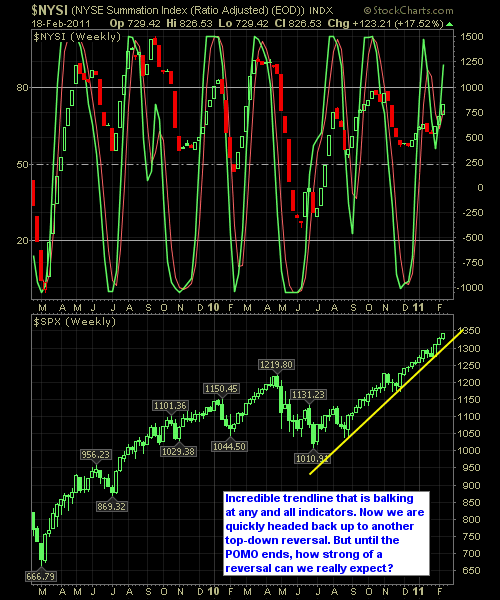
Here’s the Updated NYSE Reversal Indicator, which is interesting, because in mid-stream we’ve seen a full-out reversal back to the upside, which rarely ever happens. So at this point we are headed for another top-down signal once it hits the upper extremes. Last time this happened we actually did get some selling for a couple
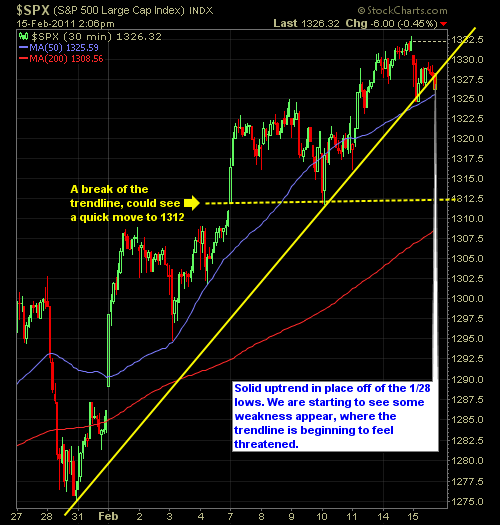
I’ve got to hand it to these bulls, it is probably going to take a major event in these markets, to get them to not see every one point move down in the S&P as some glorified buying opportunity. Right now the S&P is down a rare 5 points at the time of this post,
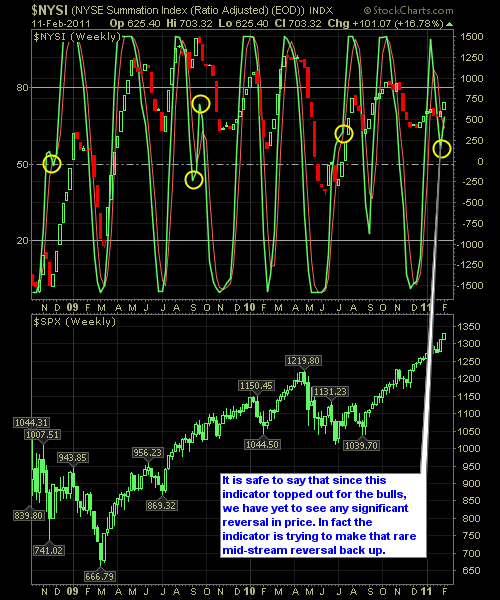
With two consecutive weeks of price rallying in the broader markets, the NYSE Indicator is showing a reversal in mid-stream, which does not occur all that often. In a little more than two years, we’ve seen four attempts by the market to reverse the course. Of those four times, three of them were traps that
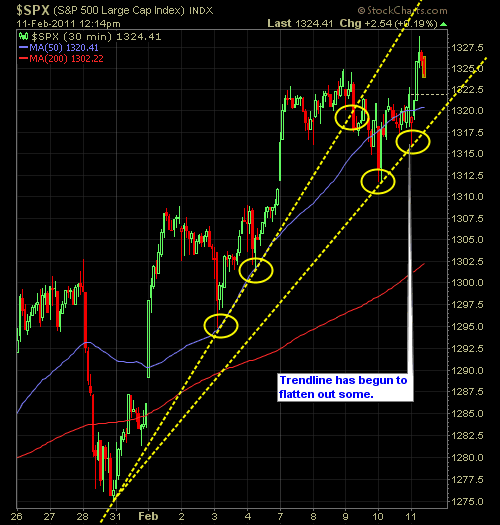
No surprise, the S&P and Nasdaq were down hard overnight, yet the market finds it in its power to snap right back at the open. At this point, we’ve seen it occur 1.2 million times since the March ’09 lows. Yet those of us who are bears, see the pattern, yet we don’t respond to it
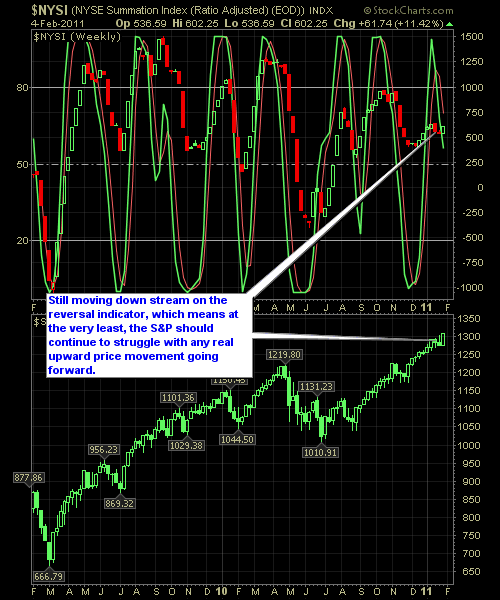
After watching the bulls scramble for the exists last Friday, to see the kind of rebound the following week is incredibly disheartening for the bears. Nonetheless, the pieces remain in place, for this market to head lower, and the NYSE Reversal Indicator supports as much too. Should the market finish higher yet again next week,
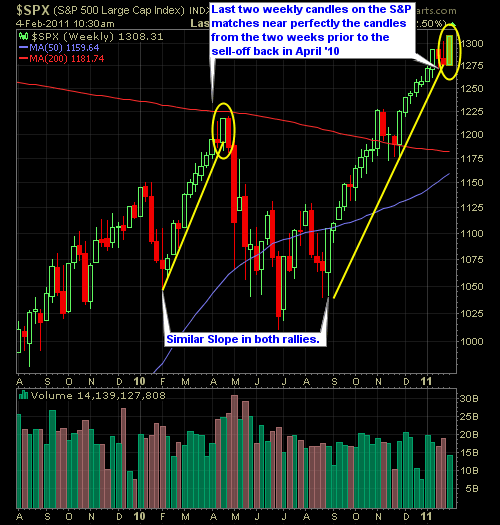
This is worth taking a look at, to see a visual of the S&P on the weekly chart, and show just how similar in scale, slope, and pattern the market action of this rally off of the September lows is to the rally we saw from January through August of last year. Even more so,

Once again, the NYSE Reversal Indicator gave us an excellent alert to the potential problems this market was heading towards. I’ll be the first to admit, that I didn’t play my hand as well as I should have in light of this information; essentially getting taken out of my positions by the Tuesday-Thursday rally, before

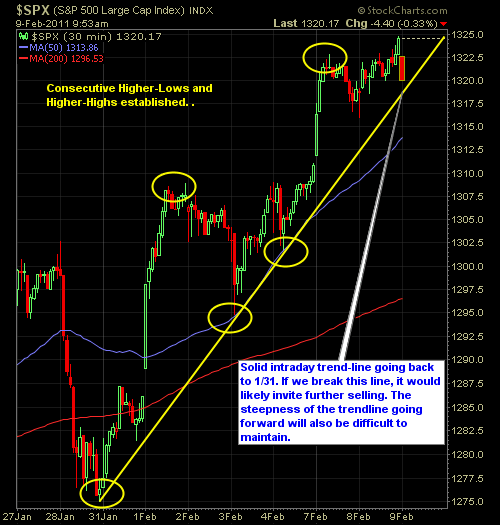
We’ve tested the 1300 on the S&P, and so far, it has been met with some rejection. In fact if you look at the S&P ETF (SPY) the high of the day is 129.99, which coincides nicely with the S&P index highs of 1299.44. The FOMC Statement that comes out at 2:15pm EST makes
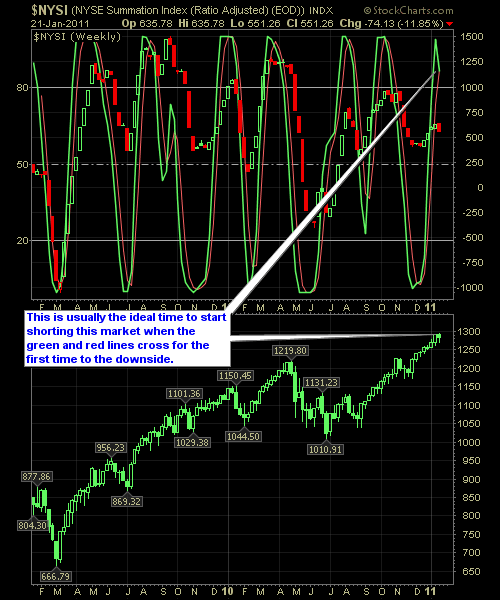
One of the best signals I can think of, pertaining on when you should start shorting the market, was given to us yesterday. The crossover in the graph below is a good indicator for further downside in the days and weeks ahead. For those of you who are not familiar with this chart, here’s quick

spc@shareplanner.com
(904) 800-8420
© Copyright 2025 | SharePlanner Inc. All Rights Reserved.
Disclaimer: The information provided on this website is for educational and informational purposes only. Ryan Mallory and/or SharePlanner are not licensed financial advisors, brokers, or tax professionals. The content on this site should not be considered as financial, investment, tax, or legal advice.
All information and opinions expressed herein are based on sources believed to be accurate and reliable. However, we make no representation or warranty as to their accuracy, completeness, or reliability. Any action you take upon the information on this website is strictly at your own risk.
Past performance is not indicative of future results. Investing involves risk, including the possible loss of principal. All investors should make their own decisions based on their specific investment objectives and financial circumstances.
This site may contain links to external websites that are not provided or maintained by or in any way affiliated with Ryan Mallory and/or SharePlanner. Please note that Ryan Mallory and/or SharePlanner do not guarantee the accuracy, relevance, timeliness, or completeness of any information on these external websites.
By using this website, you agree that Ryan Mallory and/or SharePlanner and any affiliated parties are not responsible for any losses or damages resulting from your use of or reliance on the information provided.
It is strongly recommended that you consult with a qualified professional before making any financial decisions.