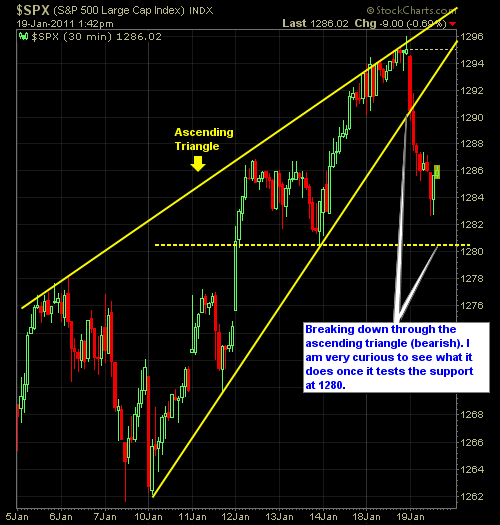
The S&P is weak for the first time in quite a while, and while we shouldn’t rule out the eternally optimistic dip-buyers from trying to rally the troops and move the market higher this afternoon, there is definitely an atmosphere of trading today that suggests that we may see additional selling in the near-term beyond
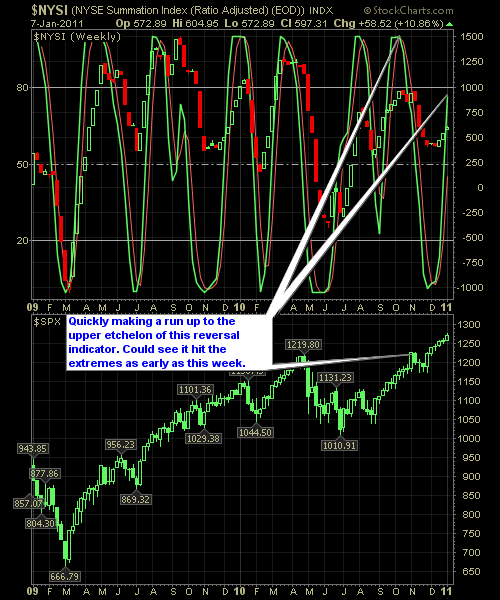
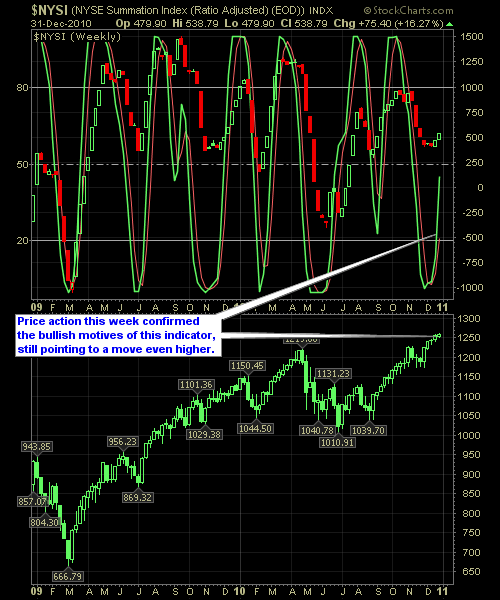
It may be as early as next week that we see this indicator show a reversal on the horizon. If that’s the case, then I would begin scaling back on your long positions, and perhaps even begin looking for short opportunities…though be very selective at doing that, and don’t rush into things too quickly. The
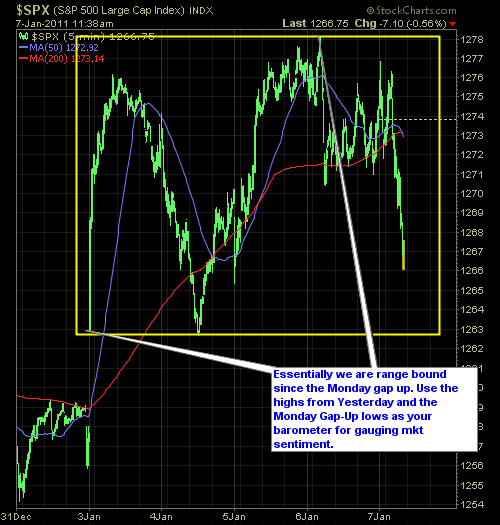
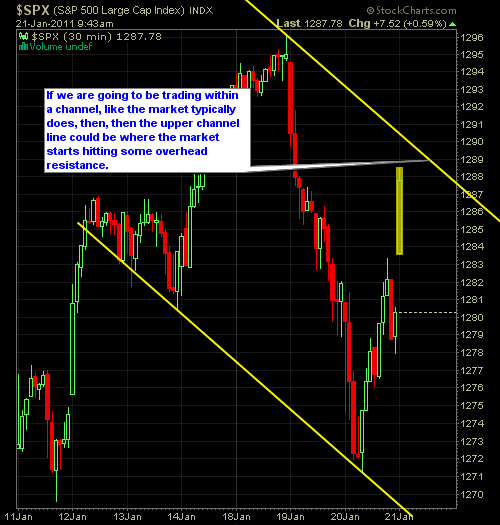
I’ve provided you a chart below showing how the S&P is essentially range bound, and that I would use a break below 1263 and a high of 1278 for determining the short-term sentiment of this market. Here’s the S&P Intra-Day Chart.
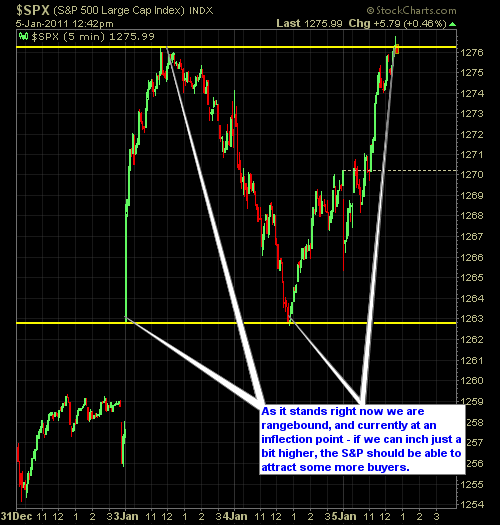
We’ve been range bound since Monday, stuck between the gap-up lows and the highs from that very same day. Since then, price has been contained within these barriers. But heading into afternoon trading, we are finally seeing some signs of life from this market, recovering off of sessions lows, when it looked like the bulls
Despite two weeks now of market action that seems to barely have a heart beat, it is still holding gains at the highs, and setting up nicely for perhaps another big rally to start the month, much like we saw back on 12/1. Purely speculation at this point, but the charts have managed to work

This is, in my opinion, one of the best ways to gauge the health of the markets, and whether it is setup for a run higher, or whether there is weakness on the horizon. As it stands right now, the market is prime to continue its march upwards, which means that we’re likely to see

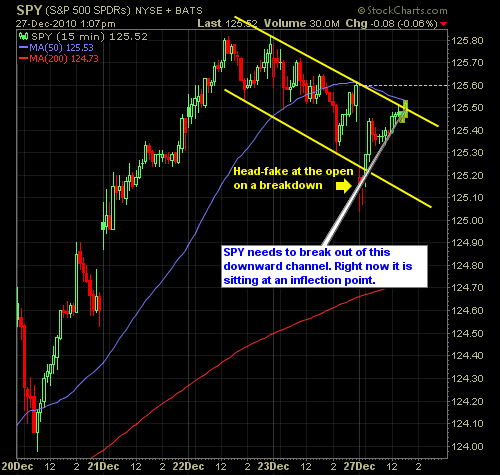
I’ve provided below a quick snapshot of the hourly chart of the S&P for the month of December, and as you can see, we are trading in a very nice channel, and of late, we are magnetized to that bottom trendline. This isn’t overly concerning to me, due to the lack of major, large-scale rallies,
-
NYSE Reversal Indicator finally gave us that long awaited “cross”. For now, at least in the short-term, the environment for trading long in this market should be pretty good, and no real reason to load on a lot of short positions at this point. For those of you who are not familiar with this chart,

spc@shareplanner.com
(904) 800-8420
© Copyright 2025 | SharePlanner Inc. All Rights Reserved.
Disclaimer: The information provided on this website is for educational and informational purposes only. Ryan Mallory and/or SharePlanner are not licensed financial advisors, brokers, or tax professionals. The content on this site should not be considered as financial, investment, tax, or legal advice.
All information and opinions expressed herein are based on sources believed to be accurate and reliable. However, we make no representation or warranty as to their accuracy, completeness, or reliability. Any action you take upon the information on this website is strictly at your own risk.
Past performance is not indicative of future results. Investing involves risk, including the possible loss of principal. All investors should make their own decisions based on their specific investment objectives and financial circumstances.
This site may contain links to external websites that are not provided or maintained by or in any way affiliated with Ryan Mallory and/or SharePlanner. Please note that Ryan Mallory and/or SharePlanner do not guarantee the accuracy, relevance, timeliness, or completeness of any information on these external websites.
By using this website, you agree that Ryan Mallory and/or SharePlanner and any affiliated parties are not responsible for any losses or damages resulting from your use of or reliance on the information provided.
It is strongly recommended that you consult with a qualified professional before making any financial decisions.