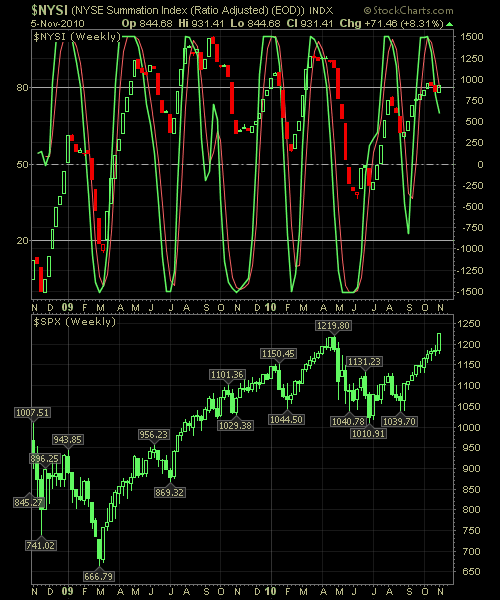
The NYSE Reversal Indicator continues to work off its overbought conditions, and has a little bend to it right now, representing the huge breakout we saw last week. Further strength this week could reverse its course, and give us another buy signal. We have yet to really see any decent amount of selling creep into

I happened to actually stumble across this interesting chart today and I want to share it with you all. What you have is the S&P using the weekly candles and a 200-week moving average. What is concerning here is how the market has tried three times now to break through it, dating back to August
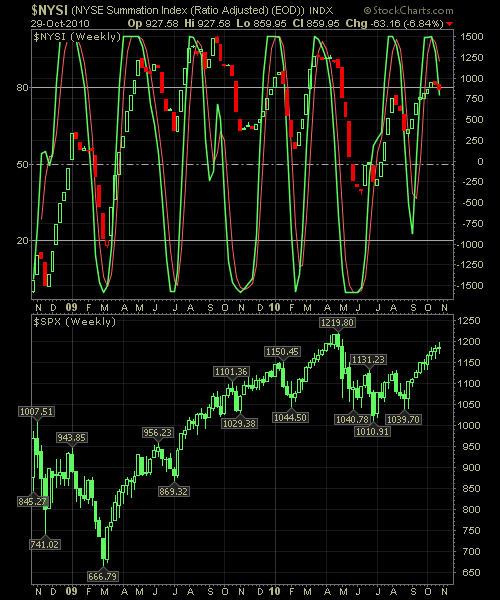
This past week’s market action was indicative of what tends to happen in the market once the NYSE Reversal Indicator starts heading south, and that is indecision and a willingness by the bulls to start taking profits. This week was as flat as you could possibly have in a market. There was no significant

The market continues to fake-out everyone. If the market is up, before the market closes, it will be down, and when the market is down, it will ultimately be up. It’s frustrating for people on both sides of the trade. The trading range continues to tighten and eventually that will lead to a major breakout

Last week I blew the whistle stating that we could see a reversal signal in the NYSE Reversal Indicator this week. And that is exactly what happened. Every time this has happened this year, we have seen a decent amount of selling enter into the markets. Sometimes lasting as much as seven weeks before the

Mr. Market is stuck in a range with a slight positive bias to it. A break below it though, and I think we have a change of sentiment on our hands. So keep an eye on the boundaries. Here’s the chart analysis.

The big players in after hours earnings reports – Ebay (EBAY) and Netflix (NFLX) – were received very favorably, and has helped push the futures into positive territory in after hours trading. I’ve provided for you below a chart on the S&P 500, looking at the intraday movement from the past 10 days
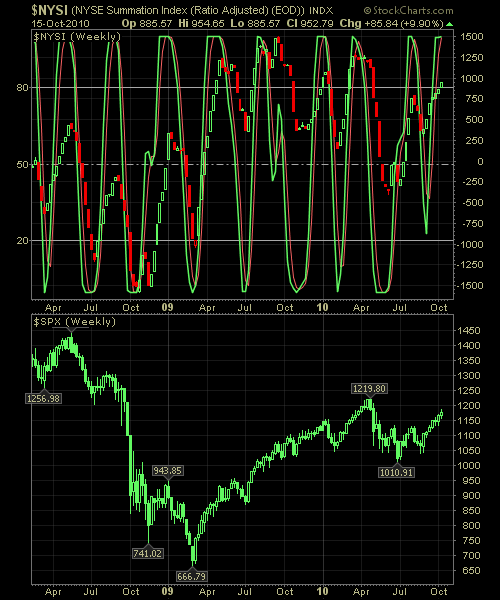
Very similar to the reading we got last week, the NYSE Reversal Indicator shows that a pullback is in the cards in the near future, but it is not quite ready to make it official. I personally look for the Green and Red lines (to keep it simple) to cross and start moving downward. However,
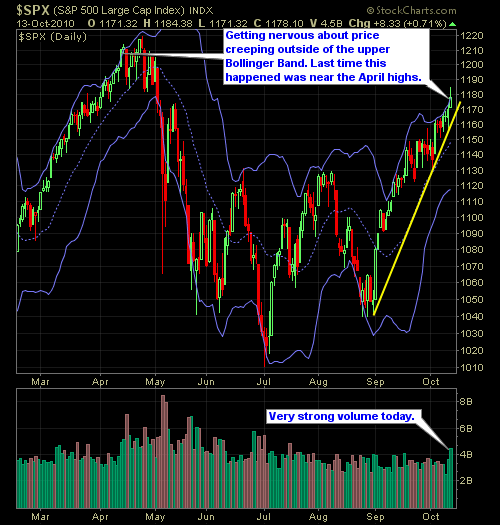
Here’s some food for the fodder – S&P creeps outside of the upper Bollinger Band, and typically when that happens we see a pullback in the short-term. So is today’s rally into unfamiliar territory a sign that we may be over extended in the very-near-term? I’m not sure, but I did hedge my portfolio, thereby
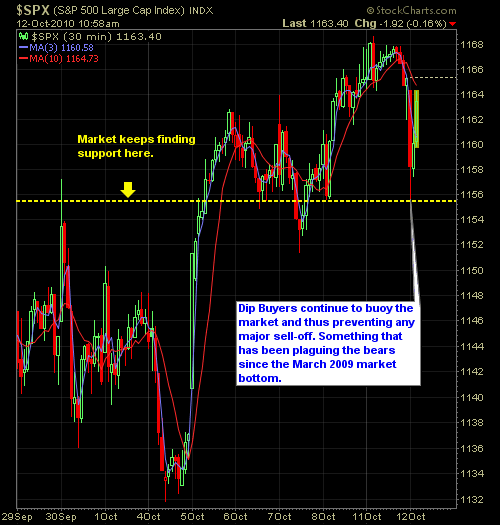
Despite repeated attempts to break through 1156, the bears simply have not found the muster to really put the fear of God in the buyers. Instead, we continue to see the market catch a bid every time at 1156. Today’s bounce, if it holds, would greatly demoralize the bears cause. As it stands right now,

spc@shareplanner.com
(904) 800-8420
© Copyright 2025 | SharePlanner Inc. All Rights Reserved.
Disclaimer: The information provided on this website is for educational and informational purposes only. Ryan Mallory and/or SharePlanner are not licensed financial advisors, brokers, or tax professionals. The content on this site should not be considered as financial, investment, tax, or legal advice.
All information and opinions expressed herein are based on sources believed to be accurate and reliable. However, we make no representation or warranty as to their accuracy, completeness, or reliability. Any action you take upon the information on this website is strictly at your own risk.
Past performance is not indicative of future results. Investing involves risk, including the possible loss of principal. All investors should make their own decisions based on their specific investment objectives and financial circumstances.
This site may contain links to external websites that are not provided or maintained by or in any way affiliated with Ryan Mallory and/or SharePlanner. Please note that Ryan Mallory and/or SharePlanner do not guarantee the accuracy, relevance, timeliness, or completeness of any information on these external websites.
By using this website, you agree that Ryan Mallory and/or SharePlanner and any affiliated parties are not responsible for any losses or damages resulting from your use of or reliance on the information provided.
It is strongly recommended that you consult with a qualified professional before making any financial decisions.