This market has been on steady decline since we’ve moved into May. This is where the typical adage of ‘Sell in May, Go Away’ comes in. The market has been going through a bend but don’t break mentality. Now something like that is usually saved for the football field, but it seems the markets would

Usually I post the weekly SharePlanner Reversal Indicator Chart (SPRI) but with futures pointing down (-13 only minutes after the open), I figured I’d show you what the Daily SharePlanner Reversal Indicator is giving us. What is most noticeable is the fact that for the first time since last May, the indicator has failed to
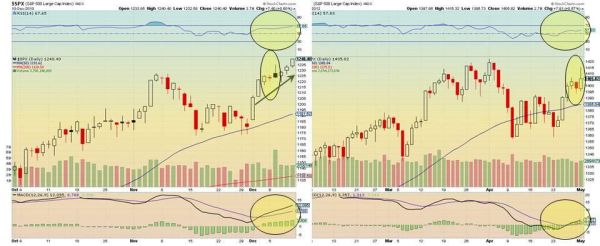
My last post compared current market action to a similar pattern setup at the end of 2010. Two days later, I thought I’d follow up with an update of how things are going. See below: On left, the old data, on the right is the current close of the S&P. History is rhyming, and the
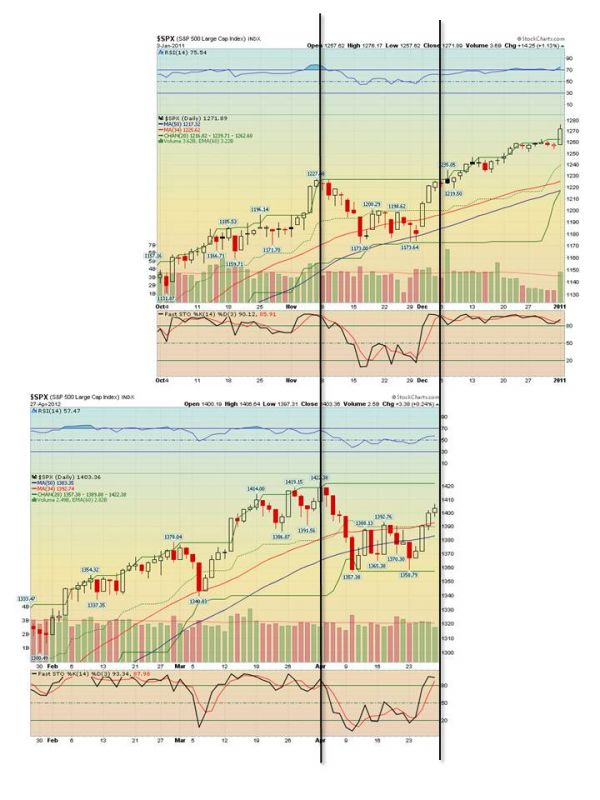
I was looking at April’s action in the indices, trying to figure out which way it’s gonna go out of this range boundary that we’ve been in since March. When looking at a (much) longer time frame, I noticed a similar-shaped pattern formed in the S&P back in 2010. I’ve tried to line them up

We are coming off of the worst week of the year for stocks, and the indices seem to be picking up momentum to the downside. We are still in bearish reversal mode, and I think that we could be setting up nicely for futher downside in the week ahead, particularly after watching panicky bulls sell
I see it’s been a month since my last post, and I recall I was in quite the mood at the time. Of course, I’m still in a mood, what with the American President apologizing to other leaders for our mistakes again, more money printing, and a baby due in about a week or two.

Of the last 10 weeks in the market, 9 of them have finished in positive territory – a streak we haven’t seen since the September 2010 bottom. The only difference between the last time and this time is that the former was coming off of a significant sell-off & market bottom, while this one started

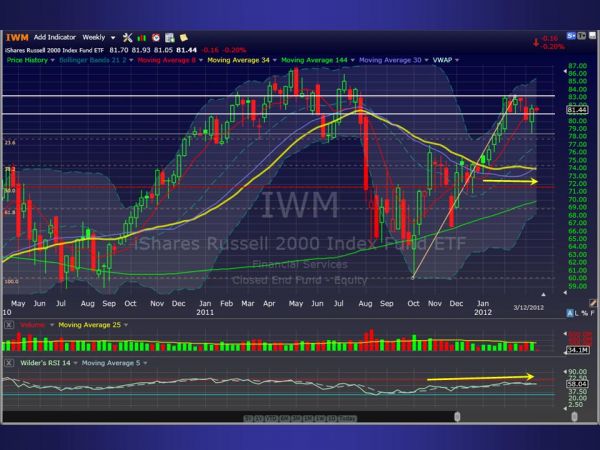
Another week of gains for the indices (unless you are the Russell of course) while there is a huge disconnect between the SharePlanner Reversal Indicator and the Market itself. At some point the divergence between the SPRI (including every name worthy indicator) and the broader markets is going to cause a break in one or

Bearish divergences exist across the board with Friday’s S&P making new highs, but indicators like the RSI, Worden T2108, and a myriad of others are pushing lower. Today we had weakness early on, but now the market appears to be holding on quite well at this point while making new recovery highs on the S&P.

How much more can we expect from news in Greece to continue juicing this market? Some will say that it’s not all about Greece – it’s about earnings too. Wrong! Take out Apple (AAPL) and earnings season was quite dismal to say the least. I will say though that AAPL has helped the markets

spc@shareplanner.com
(904) 800-8420
© Copyright 2025 | SharePlanner Inc. All Rights Reserved.
Disclaimer: The information provided on this website is for educational and informational purposes only. Ryan Mallory and/or SharePlanner are not licensed financial advisors, brokers, or tax professionals. The content on this site should not be considered as financial, investment, tax, or legal advice.
All information and opinions expressed herein are based on sources believed to be accurate and reliable. However, we make no representation or warranty as to their accuracy, completeness, or reliability. Any action you take upon the information on this website is strictly at your own risk.
Past performance is not indicative of future results. Investing involves risk, including the possible loss of principal. All investors should make their own decisions based on their specific investment objectives and financial circumstances.
This site may contain links to external websites that are not provided or maintained by or in any way affiliated with Ryan Mallory and/or SharePlanner. Please note that Ryan Mallory and/or SharePlanner do not guarantee the accuracy, relevance, timeliness, or completeness of any information on these external websites.
By using this website, you agree that Ryan Mallory and/or SharePlanner and any affiliated parties are not responsible for any losses or damages resulting from your use of or reliance on the information provided.
It is strongly recommended that you consult with a qualified professional before making any financial decisions.