
My last post compared current market action to a similar pattern setup at the end of 2010. Two days later, I thought I’d follow up with an update of how things are going. See below:
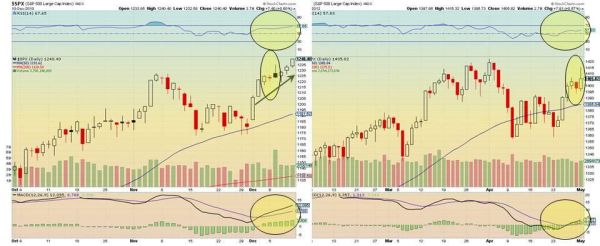
On left, the old data, on the right is the current close of the S&P. History is rhyming, and the indicators are harmonizing as they should. But surrounding factors are still showing signs of weakness, enough to say the famous last words, “this time it’s different.”
If the pattern follows history, tomorrow will see a long-tail candle but will end flat to up. Then, the next day (Thursday) will open up and challenge the highs of today, coming back to a comfortable close. It’s the following day (which will be this Friday for us) that will see the breakout to the upside as a new round of stealth QE melts prices up for 3 more months.
The big problem is still that the recent highs are not up to the level of the month-ago highs. So, even if we get a runup, there’s a level of resistance just beyond the local breakout. Of course, volume and resistance mean nothing to Central Bank policy while Easing is in effect, whatever form it takes at the time. I believe the current float has been due slightly to Operation Twist, with more thanks to the Bank Of Japan adding more liquidity.
Also weighing-in this week is a supposed Fed announcement to adopt floating-rate Treasuries, which is a signal that they are getting prepared for rising interest rates. The effect of this is intended to flush out bond holders and move that money into stocks. This would be a good springboard for a magical, pre-election Summer of higher stock prices to make things wonderful for the political incumbents.
I guess we’ll see pretty soon. Personally, I think we need to have another little dip first before prices rise back to the March highs in time for elections. Trend is up, but momentum has already been weakening. I’m not counting on new melt up until I see new highs: The S&P needs to close above 1423, a 1.22% gain, but the Russell needs to gain 3.9% to recover. I use the Russell as a leading indicator of the S&P through relative price performance, and recent performance is bearish.
However, as I already said, Central Bank tricks and maneuvres do not care for your technical patterns, indicators, or setups. The only thing that will help a technician survive are stop-losses and trend following. Good luck out there!


Welcome to Swing Trading the Stock Market Podcast!
I want you to become a better trader, and you know what? You absolutely can!
Commit these three rules to memory and to your trading:
#1: Manage the RISK ALWAYS!
#2: Keep the Losses Small
#3: Do #1 & #2 and the profits will take care of themselves.
That’s right, successful swing-trading is about managing the risk, and with Swing Trading the Stock Market podcast, I encourage you to email me (ryan@shareplanner.com) your questions, and there’s a good chance I’ll make a future podcast out of your stock market related question.
How should one go from their regular 9-5 job into full-time trading? As a swing trader, we don't have to necessarily be full-time, and instead we can combine our trading into a lifestyle that allows us to maximize our time and earning ability.
Be sure to check out my Swing-Trading offering through SharePlanner that goes hand-in-hand with my podcast, offering all of the research, charts and technical analysis on the stock market and individual stocks, not to mention my personal watch-lists, reviews and regular updates on the most popular stocks, including the all-important big tech stocks. Check it out now at: https://www.shareplanner.com/premium-plans
📈 START SWING-TRADING WITH ME! 📈
Click here to subscribe: https://shareplanner.com/tradingblock
— — — — — — — — —
💻 STOCK MARKET TRAINING COURSES 💻
Click here for all of my training courses: https://www.shareplanner.com/trading-academy
– The A-Z of the Self-Made Trader –https://www.shareplanner.com/the-a-z-of-the-self-made-trader
– The Winning Watch-List — https://www.shareplanner.com/winning-watchlist
– Patterns to Profits — https://www.shareplanner.com/patterns-to-profits
– Get 1-on-1 Coaching — https://www.shareplanner.com/coaching
— — — — — — — — —
❤️ SUBSCRIBE TO MY YOUTUBE CHANNEL 📺
Click here to subscribe: https://www.youtube.com/shareplanner?sub_confirmation=1
🎧 LISTEN TO MY PODCAST 🎵
Click here to listen to my podcast: https://open.spotify.com/show/5Nn7MhTB9HJSyQ0C6bMKXI
— — — — — — — — —
💰 FREE RESOURCES 💰
— — — — — — — — —
🛠 TOOLS OF THE TRADE 🛠
Software I use (TC2000): https://bit.ly/2HBdnBm
— — — — — — — — —
📱 FOLLOW SHAREPLANNER ON SOCIAL MEDIA 📱
*Disclaimer: Ryan Mallory is not a financial adviser and this podcast is for entertainment purposes only. Consult your financial adviser before making any decisions.
You Might Like

The Retail Trading Revolution: How Small Investors Are Reshaping the Stock Market

Fading the Gap: How Large Overnight Moves in SPY and QQQ Play Out During the Trading Day

How to Trade a Bear Flag