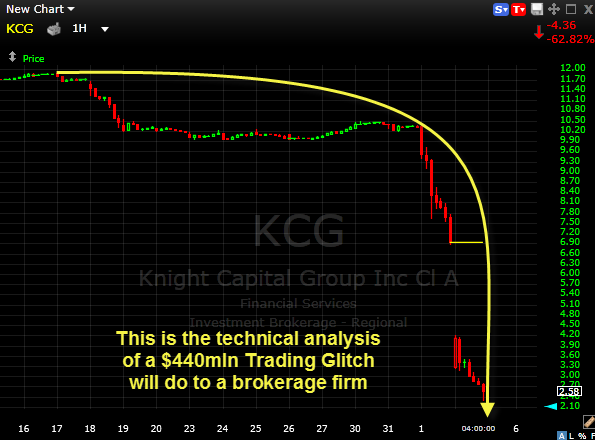
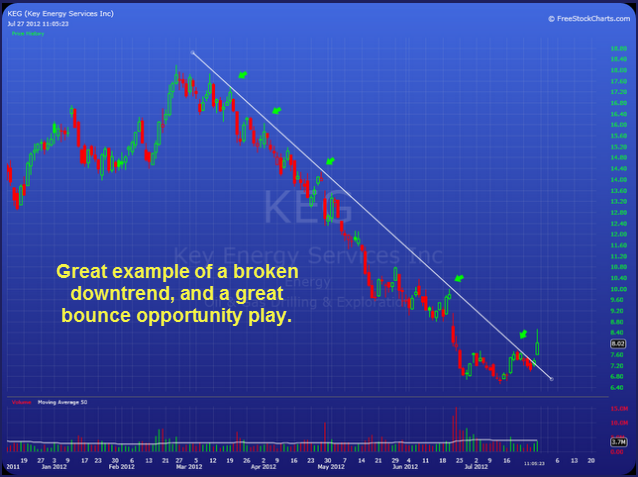
The Chart of the Day… Quick Glance at the Market Heat Map and Industries Notables: A lot of stocks on the heat map finishing the day relatively unchanged. Tech was solid, and industries like Ag and miners did better than the norm.
It’s time to update you yet again on the SharePlanner Reversal Indicator. As we talked about last week, we have a full fledged reversal signal on hand, but not a breakdown (yet, at least) in price action. We started to trickle lower four days straight but had a magnificent bounce on Friday that basically wiped out
The Chart of the Day… Quick Glance at the Market Heat Map and Industries Notables: Basic Materials reversed whatever strength it showed yesterday and tanked today. Financials no better. Services showed relative strength to the rest of the crowd.
The Chart of the Day… The 3 Step Process to Understanding the typical market reaction to the Fed’s FOMC Statement. Quick Glance at the Market Heat Map and Industries Notables: Financials, Consumer Goods, and Services really struggled. Surprisingly basic materials showed some decent strength today.
The Chart of the Day… Quick Glance at the Market Heat Map and Industries Notables: Market wasn’t down by much, but utilities and basic material had a lot of heaviness to it. Apple (AAPL) continues to rally hard since earnings.
The Chart of the Day… Quick Glance at the Market Heat Map and Industries Notables: Mixed results – like salt & pepper sprinked across the board . Financials and Healthcare looks the weakest.
The reversal signal we had been looking for the past couple of weeks, finally came to fruition and as you’ll note below we’ve got a clear bearish reversal, that is also confirmed by the RSI as well. Price action shows a convincing bearish wedge the S&P continues to trade in, but has not broken down
The Chart of the Day… Quick Glance at the Market Heat Map and Industries Notables: And suddenly everything looks right again for the markets (apparently) Tech and Finance were the leaders. Industrial looked phenomenal as well.
The Chart of the Day… Quick Glance at the Market Heat Map and Industries Notables: AAPL and CSCO were the party-poopers. Strong bounce in Financials in Basic Materials
The Chart of the Day… From SocialTrade.com Quick Glance at the Market Heat Map and Industries Notables: Strength in the market was scattered, with AAPL weighing down on the overall S&P returns. No one industry or sector that stood out from the crowd.


