The markets are hovering slightly lower on the day with the SPDR S&P 500 ETF (NYSEARCA:SPY) trading at $135.06, -0.30 (-0.22%) and the PowerShares QQQ Trust, Series 1 (ETF) (NASDAQ:QQQ) trading at $62.99, -0.06 (-0.10%). As the markets remain near their recent highs, signals of a top are all around. Here are the reasons.1. The
Howdy, SharePlanners! I had to come out of my shell to share this recent headline from the PermaBears at ZeroHedge: Market Volume Hits Fresh Non-Holiday Decade Lows. I tell ya, when I can actually see the cynicism dripping from articles as this, I have to laugh out loud. Combine the premise behind this article
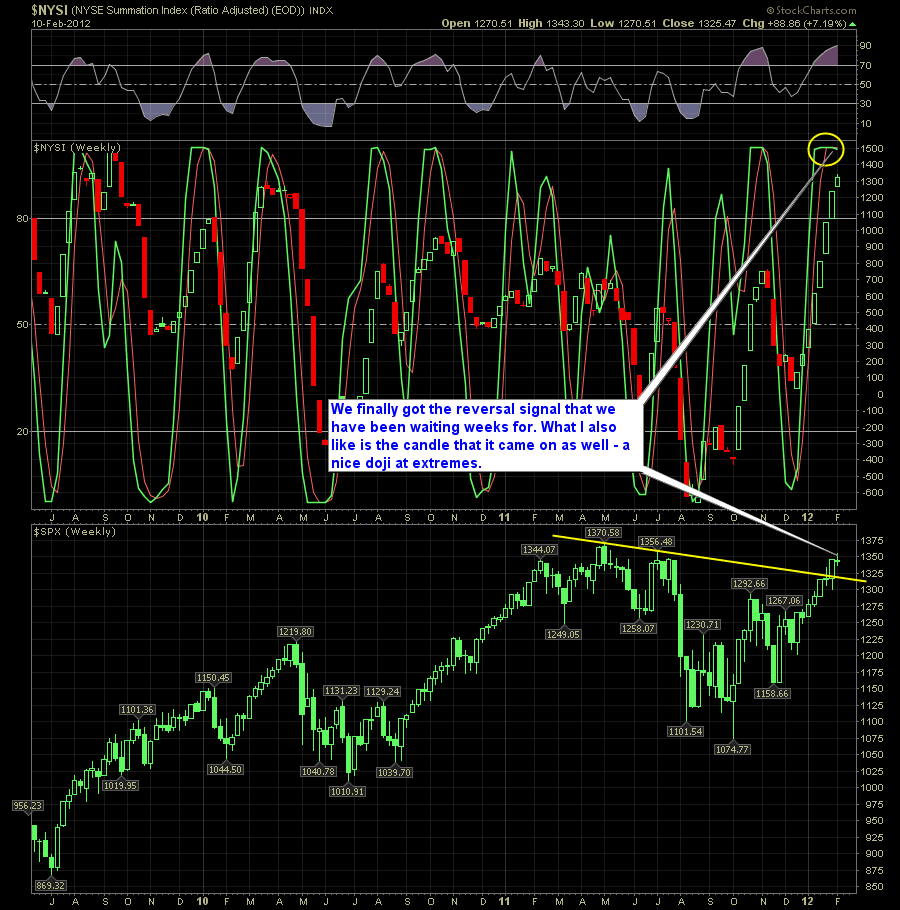
It has taken the market, what seems like an eternity, to finally cross over and start moving down again. We had our first bit of sustained selling of the new year and that has finally led to a reversal in the SPRI. This typically means at the very least, we see stock prices struggle for
We’re on week 6 of a most impressive market rally, with yet even the slightest of market pullbacks. So what can one expect really, in the weeks ahead. First, let’s take a look at market rallies dating back to 1963, nearly 50 years of market data using weekly chart data, to find out what rallies,
Economic Reports Due out (Times are EST): Treasury STRIPS (3pm) Premarket Update (Updated 8:40am eastern): US Futures are slightly lower heading into the open. Asian markets saw returns range from -0.2% up to +1.2%. European markets are down ranging from -0.2% down to -0.5%. Technical Outlook (S&P):

Last week was a ground breaking week for the markets, as we managed to break above major resistance, that dated back to the 2007 highs, and can be seen here in a shorter-time frame. We are printing extreme readings in the SPRI, but have yet to seen any relinquishing in the buying power. For those
Short Term Trend: The last signal is Bullish from 20 of December 2011. Since then, the Russell 2000 is up 12.58% and the Nasdaq 100 has risen by 10.83%. Every minor dip is followed by more buying in the market, this is the really essence of a bull market.Health of the Stock Market: This weekly

Take a quick look at the EUR/USD pairing and you will see that there was a head and shoulders confirmation today, and for the bulls, having a breakdown in the euro does not bode well for stocks. I’ve provided you with the one hour EUR/USD chart.
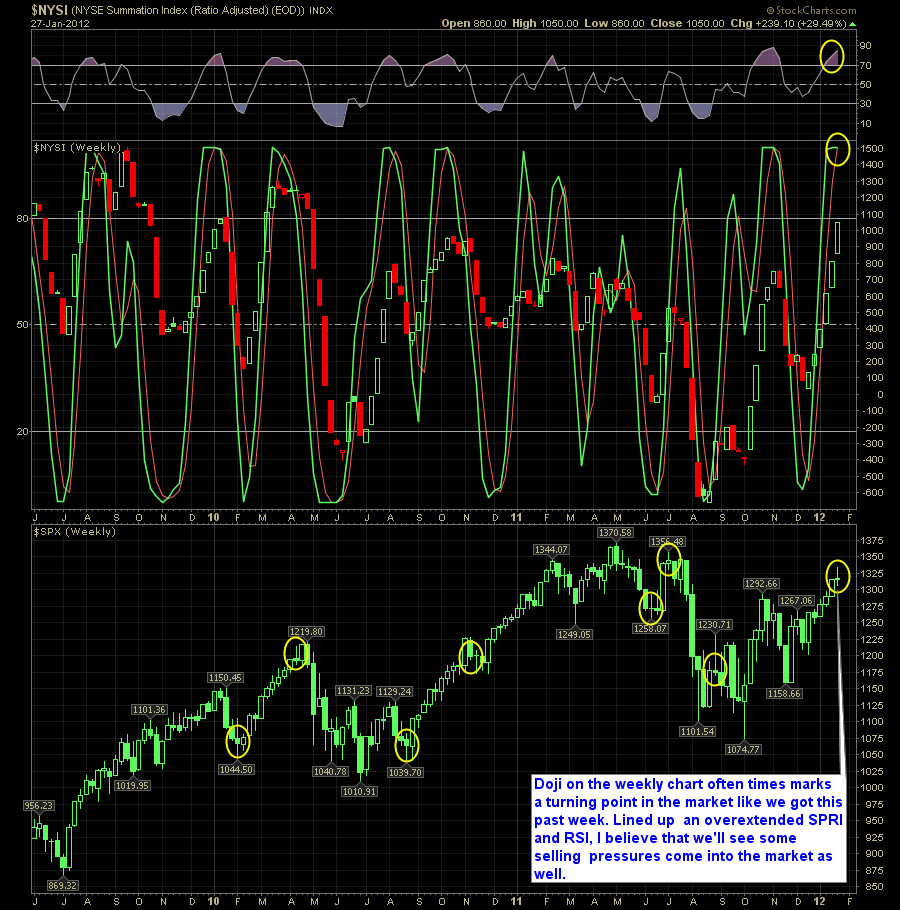
For the bulls last week, it has to mark relief that despite the constant pressures that was seen throughout nearly every trading session last week, they managed to fight back and save face before the closing bell. What we ended up with was a nasty doji weekly candle that shows the market’s bullish tendancies of

To best depict what we are currently experiencing in today’s market, with the bullish euphoria that exists, the belief that European woes have passed, and that somehow it’s different this time, let me point you to the movie clip below that comes from “Meet Joe Black”. Here you have Good ‘ole Joe and his lovely

spc@shareplanner.com
(904) 800-8420
© Copyright 2025 | SharePlanner Inc. All Rights Reserved.
Disclaimer: The information provided on this website is for educational and informational purposes only. Ryan Mallory and/or SharePlanner are not licensed financial advisors, brokers, or tax professionals. The content on this site should not be considered as financial, investment, tax, or legal advice.
All information and opinions expressed herein are based on sources believed to be accurate and reliable. However, we make no representation or warranty as to their accuracy, completeness, or reliability. Any action you take upon the information on this website is strictly at your own risk.
Past performance is not indicative of future results. Investing involves risk, including the possible loss of principal. All investors should make their own decisions based on their specific investment objectives and financial circumstances.
This site may contain links to external websites that are not provided or maintained by or in any way affiliated with Ryan Mallory and/or SharePlanner. Please note that Ryan Mallory and/or SharePlanner do not guarantee the accuracy, relevance, timeliness, or completeness of any information on these external websites.
By using this website, you agree that Ryan Mallory and/or SharePlanner and any affiliated parties are not responsible for any losses or damages resulting from your use of or reliance on the information provided.
It is strongly recommended that you consult with a qualified professional before making any financial decisions.