
Technical Analysis: S&P 500 (SPX) put together another strong rally, but under the surface, there was some signs of deterioration in the quality of the rally with the breadth to the upside being slightly outdone by declining issues. Typically, on a day like Friday, advancing issues should be rising on a 2:1 clip, at least.
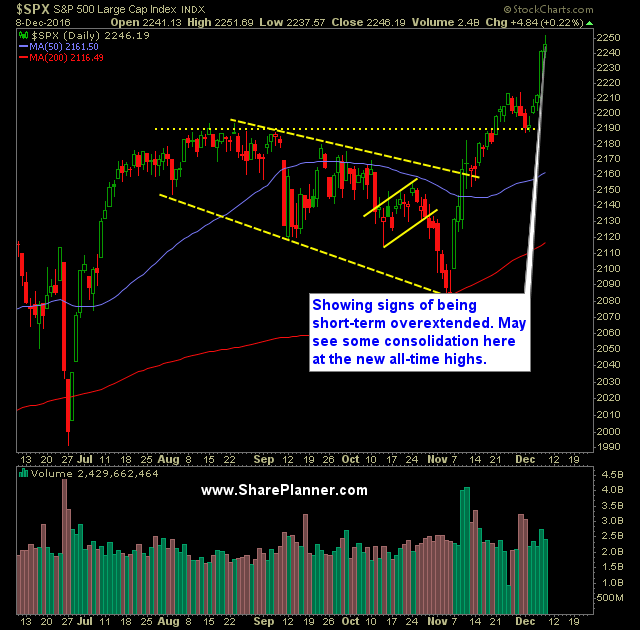
Technical Analysis: S&P 500 (SPX) rallied for a fifth straight day this week and well overextended. Still the market continues to rally. Volume on SPDRs S&P 500 (SPY) was once again above average and strong, though not to the same extent seen on Wednesday. Amazingly, SPY has been up 17 of the last 23 days since

Technical Analysis: Third straight day of higher gains for S&P 500 (SPX) after successfully holding support at the 2190 level. An intraday test of the 10-day moving average resulted in an immediate surge in price that lasted throughout the rest of the day for SPX. Russell 2000 (IWM) saw record highs yesterday after completely erasing a 5-day decline

Technical Analysis: The S&P 500 (SPX) opened strong yesterday in the wake of the Italian referendum, but as has been customary in the previous five trading sessions, the price action faded the early morning gains. On the flip side, SPX did manage to regain its 5 and 10-day moving averages. It will be important for

Technical Analysis: The S&P 500 (SPX) did little to nothing on Friday as price maintained the status quo while also upholding support at the August 2016 highs. There exists still the potential for a test of the 20-day moving average. Volume on SPDRs S&P 500 (SPY) fell for a second consecutive day, and came in below recent averages.

Technical Analysis: A rare day of near-unabated selling yesterday in the S&P 500 (SPX), that saw the index drop a resound 7.7 points! (gasp!) All kidding a side, you have the 5-day moving average starting to tilt lower, as well as the 10-day moving average being broken in a convincing manner. Good chance at this point,

Technical Analysis: Despite Oil (/CL) experiencing its biggest rally since March (+9%), the S&P 500 (SPX) sold off in the afternoon and into the close to finish in negative territory. Even with banks and oil companies soaring, it wasn’t enough to lift the market higher. Volume on SPDRs S&P 500 (SPY) had a strong bearish engulfing candle pattern

Technical Analysis: Yesterday was peculiar in the price action that unfolded on the S&P 500 (SPX) where price greatly retracted at the close of the day and gave up most of the day’s gains. This is indicating to me that market strength is being used to book recent profits. Should this happen again today, and more

Technical Analysis: Price action yesterday on S&P 500 (SPX) broke below the previous day’s trading action for the first time since 11/4 when the market capped off a 9-day losing streak. Also of note, for the first time since the Monday before the election, SPX dropped below, and closed below its 5-day moving average. Russell 2000 (

Technical Analysis: The S&P 500 (SPX) traded higher in each of the four trading sessions last week, and closed at new all-time highs at 2213. With the election behind us, the market should start to turn its attention to the Federal Reserve and the eventual rate hike that will come on December 14th when the next FOMC

spc@shareplanner.com
(904) 800-8420
© Copyright 2025 | SharePlanner Inc. All Rights Reserved.
Disclaimer: The information provided on this website is for educational and informational purposes only. Ryan Mallory and/or SharePlanner are not licensed financial advisors, brokers, or tax professionals. The content on this site should not be considered as financial, investment, tax, or legal advice.
All information and opinions expressed herein are based on sources believed to be accurate and reliable. However, we make no representation or warranty as to their accuracy, completeness, or reliability. Any action you take upon the information on this website is strictly at your own risk.
Past performance is not indicative of future results. Investing involves risk, including the possible loss of principal. All investors should make their own decisions based on their specific investment objectives and financial circumstances.
This site may contain links to external websites that are not provided or maintained by or in any way affiliated with Ryan Mallory and/or SharePlanner. Please note that Ryan Mallory and/or SharePlanner do not guarantee the accuracy, relevance, timeliness, or completeness of any information on these external websites.
By using this website, you agree that Ryan Mallory and/or SharePlanner and any affiliated parties are not responsible for any losses or damages resulting from your use of or reliance on the information provided.
It is strongly recommended that you consult with a qualified professional before making any financial decisions.