
Dead cat bounce until proven otherwise. It’ll probably take the market establishing new all-time highs in order for me to not view this market rally the last two days from a dead cat bounce perspective. There has been some technical improvements, but even still, the downtrend off of the March highs are still in
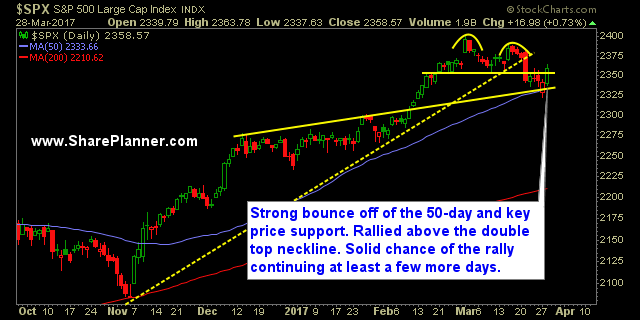
Solid bounce yesterday, but can the markets today follow through? For many years now, when we see the dead cat bounce come about, stocks overall will look to continue the bounce for several days going forward. For the markets today, will that ring true yet again? The futures are slightly down, but that has
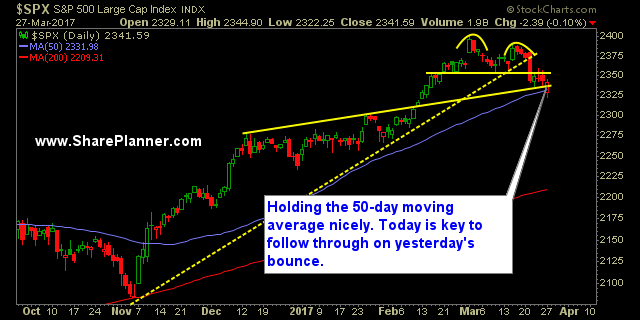
Dow Jones Chart has not been down 9 straight days since 1978 That is quite a run, to not have a sell-off of nine straight days since Jimmy Carter was president. But the Dow Jones chart is finding some support at the 50-day moving average as is the S&P 500 chart. I suspect that we’ll
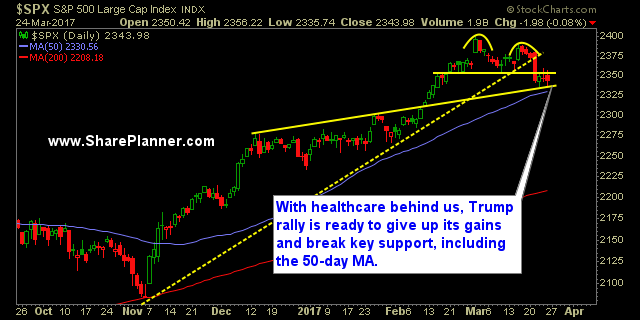
Not a stock market crash based on historical sell offs Obviously! But the sell-off that we are seeing this morning before the equity market has even opened, is far greater than what we have become used to seeing. One thing I will add here is that, based on my experience and years of observations, the
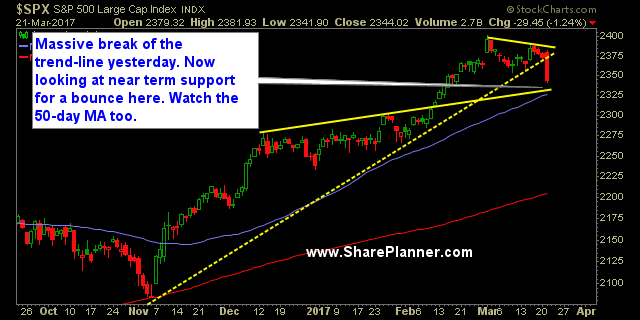
That’s why I say managing risk is so important Yes, it not a fun subject to talk about, but it is not something you cannot afford to ignore. From the highs to the lows of the day, SPX sold off 40 points and broke its key trend line. That is a massive swing considering
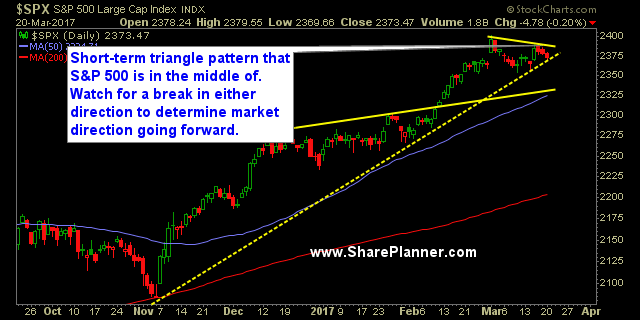
Short-term triangle pattern on SPX SPX has been coiling in a triangle pattern the past three weeks now, or essentially, this entire month of trading. It has pulled back to the rising trend-line that forms the bottom half of the triangle pattern. However, it has only experienced a mild, light volume pullback over the past

Watch the trend-line on the chart of the S&P 500 A lot can change here today or this week if the rising trend-line as noted in the chart of the S&P 500 below fails to hold. You have a potential topping pattern – emphasis on “potential” – with a new all time high that was
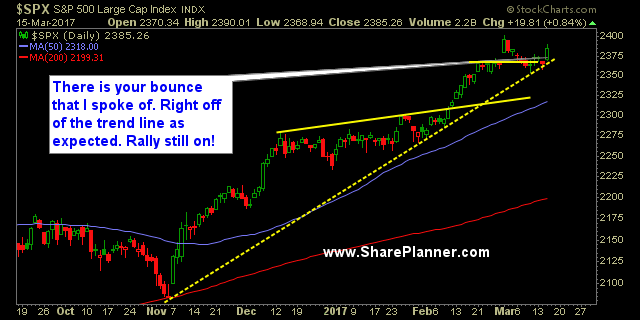
The Fed Up Rally Takes Price Back to Almost All-Time Highs Of couse I am using a play on words as this Fed Up Trump Rally is hated and despised by most and defies the logic of investing in general. I mean, c'mon it has been since last October - almost a half of a

Technical Analysis of the S&P 500's current stock trend remains in tact That doesn't necessarily mean that all the stocks out there are holding it together because most of them are not. But the large caps, the ones that really drive the market's direction, like Apple (AAPL) for instance, is still holding it together and

Stock TA Diverging Hard from Market Price Action The price action is dull in the overall market, and while the price on the indices still hovers at the all-time highs, the TA of stocks (technical analysis) continues to falter under the surface. Breadth is dismal, and without a catalyst to continue pushing the market higher

spc@shareplanner.com
(904) 800-8420
© Copyright 2025 | SharePlanner Inc. All Rights Reserved.
Disclaimer: The information provided on this website is for educational and informational purposes only. Ryan Mallory and/or SharePlanner are not licensed financial advisors, brokers, or tax professionals. The content on this site should not be considered as financial, investment, tax, or legal advice.
All information and opinions expressed herein are based on sources believed to be accurate and reliable. However, we make no representation or warranty as to their accuracy, completeness, or reliability. Any action you take upon the information on this website is strictly at your own risk.
Past performance is not indicative of future results. Investing involves risk, including the possible loss of principal. All investors should make their own decisions based on their specific investment objectives and financial circumstances.
This site may contain links to external websites that are not provided or maintained by or in any way affiliated with Ryan Mallory and/or SharePlanner. Please note that Ryan Mallory and/or SharePlanner do not guarantee the accuracy, relevance, timeliness, or completeness of any information on these external websites.
By using this website, you agree that Ryan Mallory and/or SharePlanner and any affiliated parties are not responsible for any losses or damages resulting from your use of or reliance on the information provided.
It is strongly recommended that you consult with a qualified professional before making any financial decisions.