
Technical Outlook: Friday’s price action on the S&P 500 (SPX) came back with a strong bearish engulfing candle pattern. The price action of the last two weeks has gone absolutely nowhere. SPX is trading in a triangle range that continues to narrow, and with Friday’s price action, broke down and below the lower trend-line. Volume on SPDRs
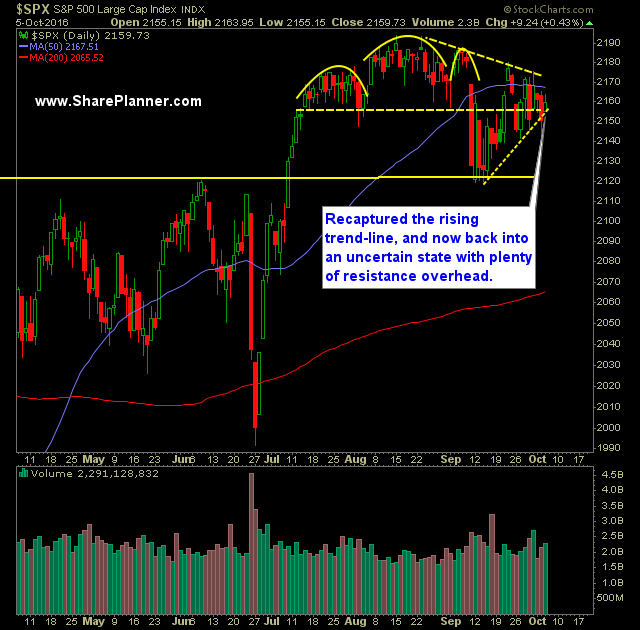
Technical Outlook: S&P 500 (SPX) yesterday managed to bounce following yesterday’s sell-off. SPX has a strong rising trendline that goes back to the February lows and will be tested at 2139. A lot of resistance overhead for the market between 2160 and 2190 on SPX. Volume on SPDRs S&P 500 (SPY) dropped off dramatically yesterday and came in well

Technical Outlook: S&P 500 (SPX) broke the four days of up/down with an additional day to the downside yesterday. As always, the bulls manage to mitigate the losses by erasing around 40% of the losses in the final hours of trading. Crude (/CL) is rallying hard in the pre-market, as it is already 2%. Despite the break
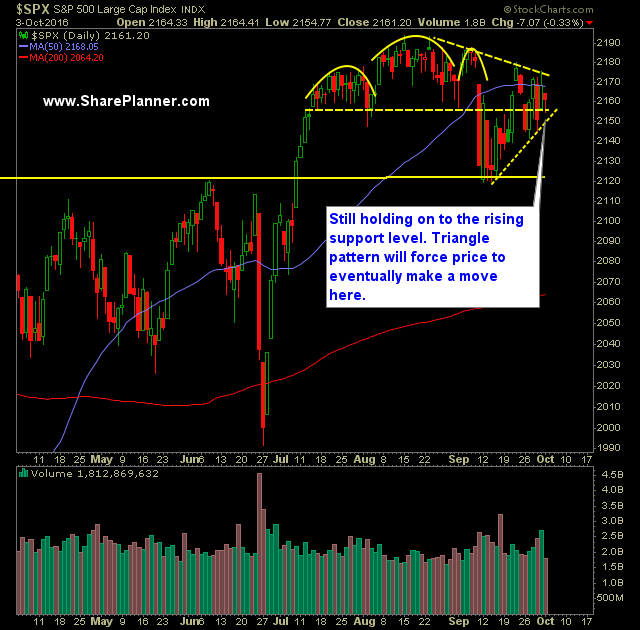
Technical Outlook: Second straight “inside-day” for the S&P 500 (SPX) where price closed inside the body of the previous day’s price action. There is a rising trend-line off of the September lows that continues to hold strong for the bulls. Couple that with the declining trend-line from the August all-time highs, and you have yourself a
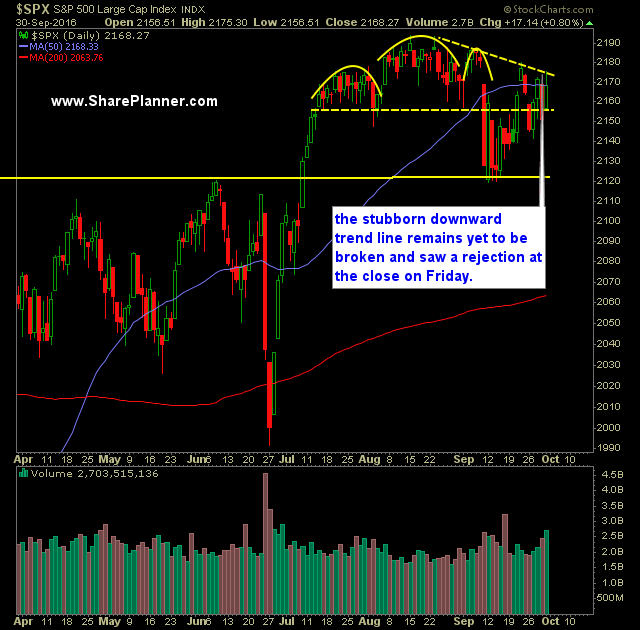
Technical Outlook: As it always does, the S&P 500 (SPX) managed to bounce following a hard sell-off the day before to erase nearly all the losses on the day. What is most peculiar though was the failed attempt by the bulls to push the market over the declining trend-line from the all-time highs established back in August.
Technical Outlook: And just like that, without a moment's notice, the market puts the bulls on notice with Deutsche Bank (DB) faltering. The result yesterday was the S&P 500 (SPX) suddenly selling off hard and taking the whole market lower. SPX looks to bounce this morning based on the futures rallying with the European market open (about

Technical Outlook: Bulls managed to string together two successful days of trading that will now put price right below the declining trend-line on the S&P 500 (SPX) downward trend-line off of the all-time highs that was achieved back in August. Volume on the SPDRs S&P 500 (SPY) actually increased yesterday and was well above recent averages. Yesterday’s rally

Technical Outlook: The whipsaw price action in S&P 500 (SPX) continued yesterday with a hard bounce following two days of selling. The price action is sporadic and unpredictable at this juncture. Very topsy-turvy – Last Thursday you had a bullish break above recent consolidation. Following Monday’s price action, you had a bear flag pattern playing

Technical Outlook: Big move for the S&P 500 (SPX) yesterday, as Monday’s sell-off took price back below the 5, 10 and 20-day moving averages. Watch the rising trend-line off of the February lows on SPX as a test looms at 2124 area. SPDRs S&P 500 (SPY) volume saw an increase yesterday, and came in at

Technical Outlook: Strong sell-off on S&P 500 (SPX) on Friday that resulted in a break of the 50-day moving average. Trend-line off of the all-time highs on SPX offered steep resistance on Thursday that ultimately resulted in Friday’s sell-off. Rising trend-line off of the February lows is back in play with a potential test area at 2124.

spc@shareplanner.com
(904) 800-8420
© Copyright 2025 | SharePlanner Inc. All Rights Reserved.
Disclaimer: The information provided on this website is for educational and informational purposes only. Ryan Mallory and/or SharePlanner are not licensed financial advisors, brokers, or tax professionals. The content on this site should not be considered as financial, investment, tax, or legal advice.
All information and opinions expressed herein are based on sources believed to be accurate and reliable. However, we make no representation or warranty as to their accuracy, completeness, or reliability. Any action you take upon the information on this website is strictly at your own risk.
Past performance is not indicative of future results. Investing involves risk, including the possible loss of principal. All investors should make their own decisions based on their specific investment objectives and financial circumstances.
This site may contain links to external websites that are not provided or maintained by or in any way affiliated with Ryan Mallory and/or SharePlanner. Please note that Ryan Mallory and/or SharePlanner do not guarantee the accuracy, relevance, timeliness, or completeness of any information on these external websites.
By using this website, you agree that Ryan Mallory and/or SharePlanner and any affiliated parties are not responsible for any losses or damages resulting from your use of or reliance on the information provided.
It is strongly recommended that you consult with a qualified professional before making any financial decisions.