
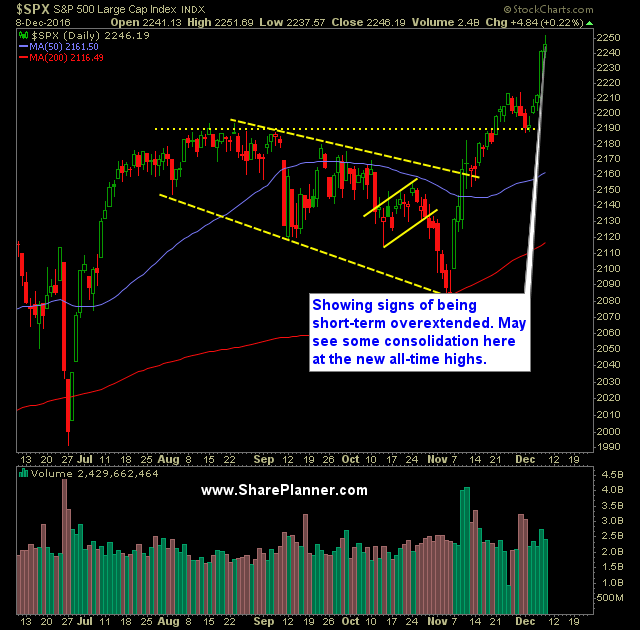
Technical Analysis:
- S&P 500 (SPX) rallied for a fifth straight day this week and well overextended. Still the market continues to rally.
- Volume on SPDRs S&P 500 (SPY) was once again above average and strong, though not to the same extent seen on Wednesday.
- Amazingly, SPY has been up 17 of the last 23 days since the week of the election – a 74% win rate, with dips quickly getting bought up.
- Quick bounce in CBOE Market Volatility Index (VIX) looks to be short lived, as the bounce itself is light and lacking momentum.
- Respectable bounce out of oil yesterday, after filling the gap on United States Oil Fund (USO) and bouncing higher thereafter. Look for another retest of the October highs.
- As I’ve said before, oil only matters when it is rallying. When it sells off, the market completely shrugs off its impact on the economy.
- SPX on the 30 minute chart is definitely stretched. and started showing signs late yesterday of consolidation.
- T2108 (% of stocks trading above their 40-day moving average) is rallying well right now with 75% of stocks above their MA. There is still room to run as it does’t get overbought until the 80’s are reached.
- The Federal Reserve has no choice but to raise rates next week. They are out of excuses and have put themselves into a corner. So far the market hasn’t paid a rate hike any thought. Last year the market didn’t sell off until after the FOMC Statement.
My Trades:
- Did not add any new trades to the portfolio yesterday.
- Did not close out any positions yesterday.
- May look to add some short exposure as a hedge against current positions.
- I will look to add 1-2 new swing-trades to the portfolio today.
- I am currently 50% Long / 50% Cash
Chart for SPX:


Welcome to Swing Trading the Stock Market Podcast!
I want you to become a better trader, and you know what? You absolutely can!
Commit these three rules to memory and to your trading:
#1: Manage the RISK ALWAYS!
#2: Keep the Losses Small
#3: Do #1 & #2 and the profits will take care of themselves.
That’s right, successful swing-trading is about managing the risk, and with Swing Trading the Stock Market podcast, I encourage you to email me (ryan@shareplanner.com) your questions, and there’s a good chance I’ll make a future podcast out of your stock market related question.
In this podcast episode, Ryan discusses how really bad, losing trades in the stock market creates an impossible scenario for the trader in terms of what the right decision should be.
Be sure to check out my Swing-Trading offering through SharePlanner that goes hand-in-hand with my podcast, offering all of the research, charts and technical analysis on the stock market and individual stocks, not to mention my personal watch-lists, reviews and regular updates on the most popular stocks, including the all-important big tech stocks. Check it out now at: https://www.shareplanner.com/premium-plans
📈 START SWING-TRADING WITH ME! 📈
Click here to subscribe: https://shareplanner.com/tradingblock
— — — — — — — — —
💻 STOCK MARKET TRAINING COURSES 💻
Click here for all of my training courses: https://www.shareplanner.com/trading-academy
– The A-Z of the Self-Made Trader –https://www.shareplanner.com/the-a-z-of-the-self-made-trader
– The Winning Watch-List — https://www.shareplanner.com/winning-watchlist
– Patterns to Profits — https://www.shareplanner.com/patterns-to-profits
– Get 1-on-1 Coaching — https://www.shareplanner.com/coaching
— — — — — — — — —
❤️ SUBSCRIBE TO MY YOUTUBE CHANNEL 📺
Click here to subscribe: https://www.youtube.com/shareplanner?sub_confirmation=1
🎧 LISTEN TO MY PODCAST 🎵
Click here to listen to my podcast: https://open.spotify.com/show/5Nn7MhTB9HJSyQ0C6bMKXI
— — — — — — — — —
💰 FREE RESOURCES 💰
— — — — — — — — —
🛠 TOOLS OF THE TRADE 🛠
Software I use (TC2000): https://bit.ly/2HBdnBm
— — — — — — — — —
📱 FOLLOW SHAREPLANNER ON SOCIAL MEDIA 📱
FACEBOOK: https://facebook.com/shareplanner
*Disclaimer: Ryan Mallory is not a financial adviser and this podcast is for entertainment purposes only. Consult your financial adviser before making any decisions.
You Might Like

South Korea: The Hidden Driver of US Tech Volatility

Stop Trying to Hit Home Runs: Start Trading Within Your Means

How to Trade Breakouts Without Getting Trapped