

Technical Analysis:
- A rare day of near-unabated selling yesterday in the S&P 500 (SPX), that saw the index drop a resound 7.7 points! (gasp!)
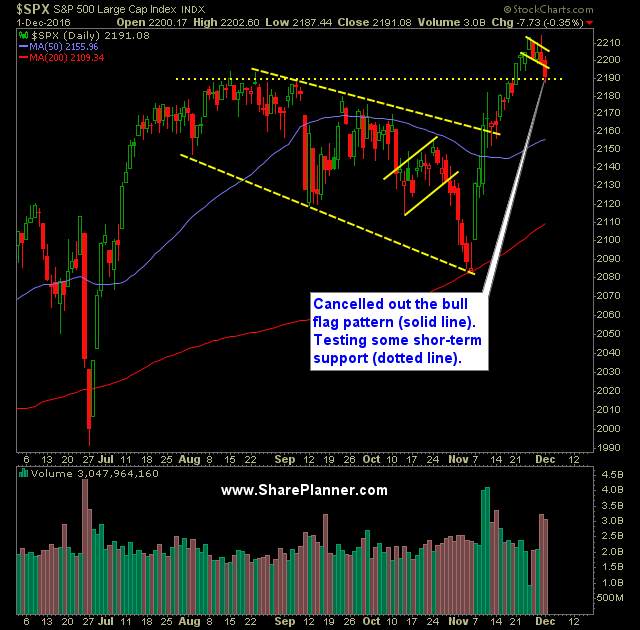
- All kidding a side, you have the 5-day moving average starting to tilt lower, as well as the 10-day moving average being broken in a convincing manner. Good chance at this point, we see a test of the 20-day moving average.
- SPX settled in at a key support (short-term) at the August high consolidation levels.
- The most notable selling however, took place in the Nasdaq (COMPQ) where the index shed over two percent (128 points) in the last two days. Software and Semiconductors are getting absolutely hammered right now.
- Also, Nasdaq dropped below its 20 and 50-day moving averages yesterday and could see a scenario where it retests its November lows.
- Oil continued its surge yesterday with the United States Oil Fund (USO) surging another 3.7%, but forming a concerning blow-off top-like candle, or shooting star some would say.
- Most of the Thanksgiving week holiday gains have been wiped out by the downturn experienced this week.
- Down tick in the daily volume on SPDRs S&P 500 (SPY) yesterday, and just a shade below recent averages.
- Volatility saw a 5.6% pop yesterday back over 14, but still endured an afternoon sell-off from its highs creating a large shadow above its candle body. This continues to be the theme of the CBOE Market Volatility Index (VIX) regardless of what equities actually do.
- Money is flowing, once again, out of tech and back into banks and now into oil too.
- Following a 15-day rally on the Russell (IWM), it experienced its fourth straight day of selling and broke below its 10-day moving average. There is very little support underneath current price action.
- The last two times there was a massive +10% rally in the Russell Index in a given month, the next month led to substantial sell-offs. December though isn’t known for major sell-offs, in part due to the ‘Santa Rally’ effect.
- Lower highs continue to be made on the T2108 (% of stocks trading above their 40-day moving average) and has established lower-highs on each major surge to new highs that occurred in July and again in November. This should be a major concern for traders as the the highs aren’t being made on substantial breadth across the market. Typically I would expect well over 80% of stocks trading above their 40-day moving average when price is at all time highs. Right now it is at 60%.
- With the election behind us, the market should start to turn its attention to the Federal Reserve and the eventual rate hike that will come on December 14th when the next FOMC statement is released.
- If it is anything like last December, it should create some jitters in the market as well as a potential selling catalyst that leads to a significant sell-off.
My Trades:
- Covered my short position in ADBE yesterday at $98.90 for a 5.0% profit.
- Added one additional position to the portfolio yesterday.
- Will look to increase my stop-losses on existing positions today.
- I will look to add 1-2 new swing-trades to the portfolio today.
- I am currently 30% Short / 70% Cash
Chart for SPX:


Welcome to Swing Trading the Stock Market Podcast!
I want you to become a better trader, and you know what? You absolutely can!
Commit these three rules to memory and to your trading:
#1: Manage the RISK ALWAYS!
#2: Keep the Losses Small
#3: Do #1 & #2 and the profits will take care of themselves.
That’s right, successful swing-trading is about managing the risk, and with Swing Trading the Stock Market podcast, I encourage you to email me (ryan@shareplanner.com) your questions, and there’s a good chance I’ll make a future podcast out of your stock market related question.
In this podcast episode, Ryan discusses how really bad, losing trades in the stock market creates an impossible scenario for the trader in terms of what the right decision should be.
Be sure to check out my Swing-Trading offering through SharePlanner that goes hand-in-hand with my podcast, offering all of the research, charts and technical analysis on the stock market and individual stocks, not to mention my personal watch-lists, reviews and regular updates on the most popular stocks, including the all-important big tech stocks. Check it out now at: https://www.shareplanner.com/premium-plans
📈 START SWING-TRADING WITH ME! 📈
Click here to subscribe: https://shareplanner.com/tradingblock
— — — — — — — — —
💻 STOCK MARKET TRAINING COURSES 💻
Click here for all of my training courses: https://www.shareplanner.com/trading-academy
– The A-Z of the Self-Made Trader –https://www.shareplanner.com/the-a-z-of-the-self-made-trader
– The Winning Watch-List — https://www.shareplanner.com/winning-watchlist
– Patterns to Profits — https://www.shareplanner.com/patterns-to-profits
– Get 1-on-1 Coaching — https://www.shareplanner.com/coaching
— — — — — — — — —
❤️ SUBSCRIBE TO MY YOUTUBE CHANNEL 📺
Click here to subscribe: https://www.youtube.com/shareplanner?sub_confirmation=1
🎧 LISTEN TO MY PODCAST 🎵
Click here to listen to my podcast: https://open.spotify.com/show/5Nn7MhTB9HJSyQ0C6bMKXI
— — — — — — — — —
💰 FREE RESOURCES 💰
— — — — — — — — —
🛠 TOOLS OF THE TRADE 🛠
Software I use (TC2000): https://bit.ly/2HBdnBm
— — — — — — — — —
📱 FOLLOW SHAREPLANNER ON SOCIAL MEDIA 📱
FACEBOOK: https://facebook.com/shareplanner
*Disclaimer: Ryan Mallory is not a financial adviser and this podcast is for entertainment purposes only. Consult your financial adviser before making any decisions.

You Might Like

South Korea: The Hidden Driver of US Tech Volatility

Stop Trying to Hit Home Runs: Start Trading Within Your Means

How to Trade Breakouts Without Getting Trapped