
Technical Outlook:
- Hard sell-off to close out 2015 on Friday, that saw selling rapidly increase in the afternoon, and most noticeably in the final 30 minutes of trading. For the year SPX closed 1% lower for 2015.
- The selling looks to continue into the open today as futures are currently down 36 points on SPX futures (ES), and over 300 points on the Dow futures (YM).
- Essentially the market is looking at a near 2% gap down to start the year off.
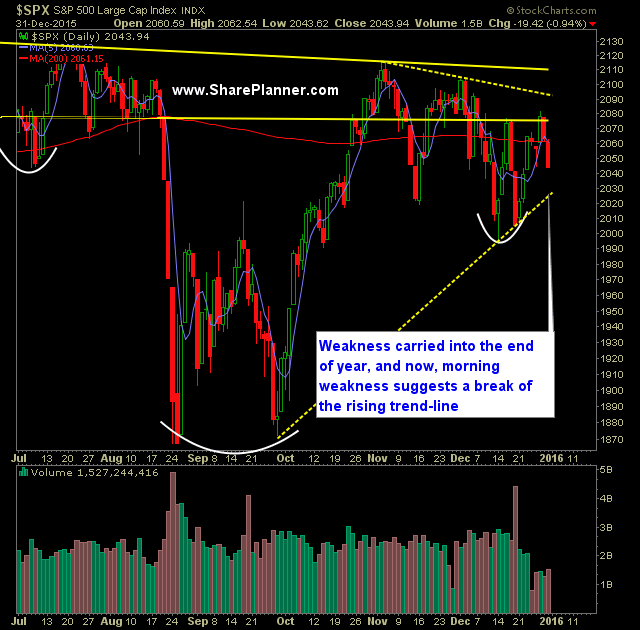
- With the selling on Friday, SPX is now trading below the 10, 20 and 200-day moving averages as it also managed to break the 50 day moving average the day prior.
- SPY is very close to breaking the $200.00 price level. A close below $199.83 would likely set up a scenario where price goes back down to August/September lows.
- Potential head and shoulders pattern forming on SPY going back to November of 2014. Though a very sloppy one.
- A particular concern today is the break in the rising trend-line off of the September lows. This price level has held on two previous occasions back in December.
- Large gap downs like what we are seeing right now are usually difficult to sustain on the futures, but this move here comes, in fact, after the futures gapped up on Sunday night and has subsequently sold off 43 points since then.
- Lots of theories floats around January stock performance, from the first day, first three days, and first week of trading being a barometer for the returns of the rest of the year. I don’t put much weight behind these theories, and find them highly circumstantial.
- January has been a very volatile month in recent years to trade. Careful navigating it.
- The last 30 trading days of 2015 finished lower for the first time in the last 12 years. It is also safe to say, at this point, that the Santa Rally was a dud!
- SPX 30 minute chart confirmed a head and shoulders pattern at the close of trading.
- Not a lot of movement out of the VIX on Friday, moving only 5.3% higher to 18.21.
- T2108 (% of stocks trading above their 40-day moving average) dropped 10 points down to 32% and beginning to show signs of breaking down.
- SPX will need to aim for a close above 2024 to hold the trend-line off of the September lows today.
- The Nasdaq, for the month of December was stuck in a triangle pattern and looks to break down and out of it today.
- Expect volume levels to return back to normal today after two weeks of holiday volume.
My Trades:
- Sold all my long holdings on Friday to close out the year and went straight to cash.
- Sold UPRO at $63.29 for a 4.4% gain.
- Sold QLD at $78.69 for 2.5% gain.
- Sold UTX at $96.24 for a 1.8% gain.
- Sold SYMC at $20.07 for a 0.5% gain.
- Sold ADBE at $94.23 for a 2.0% gain.
- Sold NFLX at $114.65 for a -0.4% loss.
- Sold CVX at $90.08 for a -0.5% loss.
- Will watch for possible market reversals today, and/or look to follow the market to the downside with short positions.
- Currently 100% Cash
- Join me each day for all my real-time trades and alerts in the SharePlanner Splash Zone
Chart for SPX:


Welcome to Swing Trading the Stock Market Podcast!
I want you to become a better trader, and you know what? You absolutely can!
Commit these three rules to memory and to your trading:
#1: Manage the RISK ALWAYS!
#2: Keep the Losses Small
#3: Do #1 & #2 and the profits will take care of themselves.
That’s right, successful swing-trading is about managing the risk, and with Swing Trading the Stock Market podcast, I encourage you to email me (ryan@shareplanner.com) your questions, and there’s a good chance I’ll make a future podcast out of your stock market related question.
Refusing to take a loss when the trade has turned, and the reason for getting into the trade in the first place is no longer valid, is one of the biggest problems traders face. In this video, Ryan Mallory discusses the pitfalls that comes with refusing to take the loss and instead opting to become a bagholder on one's trades.
Be sure to check out my Swing-Trading offering through SharePlanner that goes hand-in-hand with my podcast, offering all of the research, charts and technical analysis on the stock market and individual stocks, not to mention my personal watch-lists, reviews and regular updates on the most popular stocks, including the all-important big tech stocks. Check it out now at: https://www.shareplanner.com/premium-plans
📈 START SWING-TRADING WITH ME! 📈
Click here to subscribe: https://shareplanner.com/tradingblock
— — — — — — — — —
💻 STOCK MARKET TRAINING COURSES 💻
Click here for all of my training courses: https://www.shareplanner.com/trading-academy
– The A-Z of the Self-Made Trader –https://www.shareplanner.com/the-a-z-of-the-self-made-trader
– The Winning Watch-List — https://www.shareplanner.com/winning-watchlist
– Patterns to Profits — https://www.shareplanner.com/patterns-to-profits
– Get 1-on-1 Coaching — https://www.shareplanner.com/coaching
— — — — — — — — —
❤️ SUBSCRIBE TO MY YOUTUBE CHANNEL 📺
Click here to subscribe: https://www.youtube.com/shareplanner?sub_confirmation=1
🎧 LISTEN TO MY PODCAST 🎵
Click here to listen to my podcast: https://open.spotify.com/show/5Nn7MhTB9HJSyQ0C6bMKXI
— — — — — — — — —
💰 FREE RESOURCES 💰
— — — — — — — — —
🛠 TOOLS OF THE TRADE 🛠
Software I use (TC2000): https://bit.ly/2HBdnBm
— — — — — — — — —
📱 FOLLOW SHAREPLANNER ON SOCIAL MEDIA 📱
FACEBOOK: https://facebook.com/shareplanner
*Disclaimer: Ryan Mallory is not a financial adviser and this podcast is for entertainment purposes only. Consult your financial adviser before making any decisions.

You Might Like

South Korea: The Hidden Driver of US Tech Volatility

Stop Trying to Hit Home Runs: Start Trading Within Your Means

How to Trade Breakouts Without Getting Trapped