Episode Overview Ryan Mallory digs deep on measuring risk as it pertains to position size and stop-losses and how to take into account headline risk for your swing trades. 🎧 Listen Now: Available on: Apple Podcasts | Spotify | Amazon | YouTube Episode Highlights & Timestamps [0:58] Chester’s questionA listener asks how Ryan defines risk in practice and how withdrawals or account

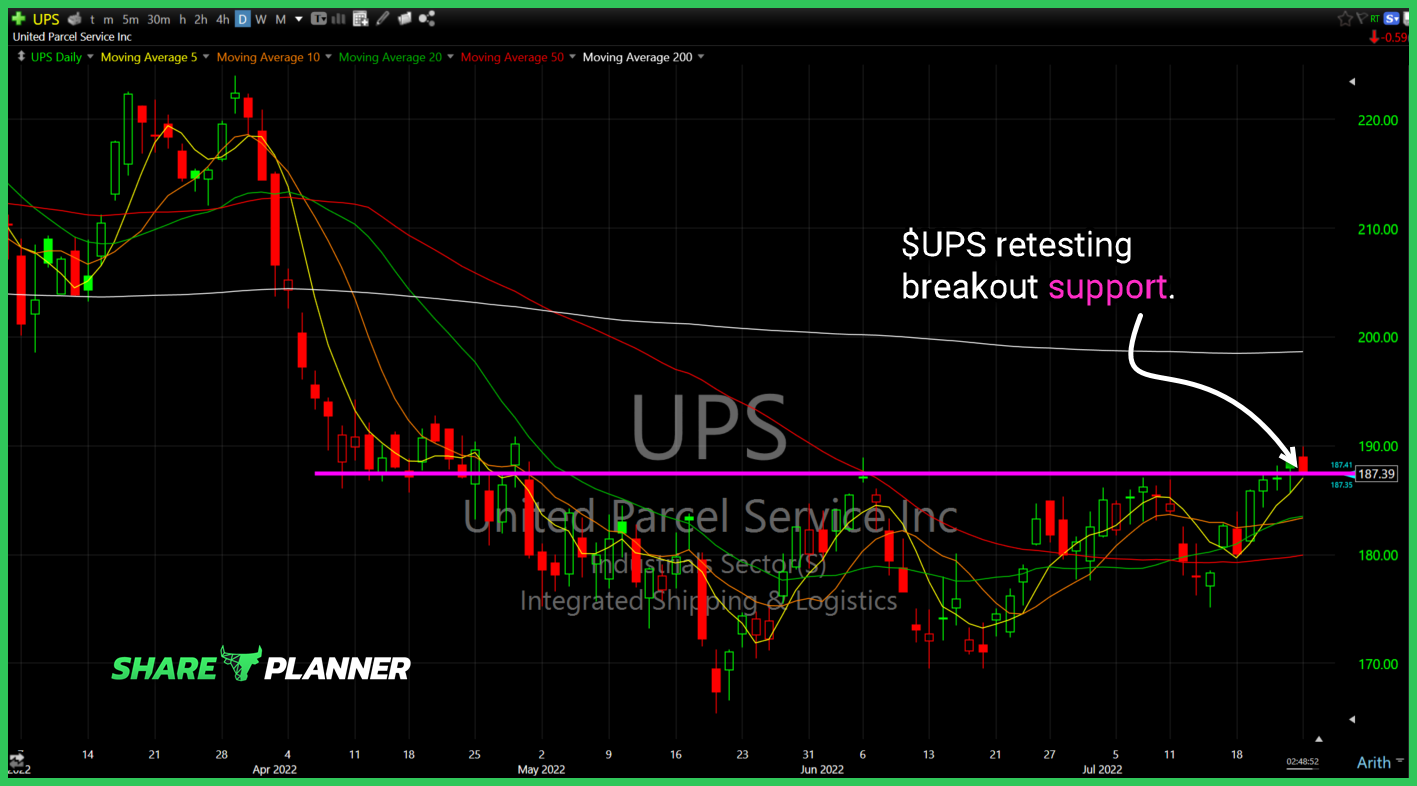
$UPS retesting breakout support. Needs to hold and bounce.

And with that $SNAP officially loses its long-term support level.

Episode Overview One trader has seen his trading account drop by 33% and after 82 trades in the stock market since February, he's asking the question, "Should I just admit that I've blown up my account, and start over?" 🎧 Listen Now: Available on: Apple Podcasts | Spotify | Amazon | YouTube Episode Highlights & Timestamps [0:07] IntroductionRyan kicks off setting up

$LRCX clearing significant resistance both short-term and mid-term.

$GME declining resistance being tested today.

$SRG pushing through significant resistance – high risk/high reward play.

Learn to let the charts tell you the story it wants to tell you. You can't be too dogmatic on particular indicators, or moving averages. Instead look for the edge that a chart might be trying to tell you and what works for one chart doesn't necessarily work for all charts when it comes to

Nancy Pelosi bought between $1 million and $5 million of Nvidia stock (NVDA). Is this the time to buy NVDA stock ahead of the possible passage of the semiconductor bill currently in Congress? How does Nancy Pelosi's stock trades measure up in this bear market?

spc@shareplanner.com
(904) 800-8420
© Copyright 2025 | SharePlanner Inc. All Rights Reserved.
Disclaimer: The information provided on this website is for educational and informational purposes only. Ryan Mallory and/or SharePlanner are not licensed financial advisors, brokers, or tax professionals. The content on this site should not be considered as financial, investment, tax, or legal advice.
All information and opinions expressed herein are based on sources believed to be accurate and reliable. However, we make no representation or warranty as to their accuracy, completeness, or reliability. Any action you take upon the information on this website is strictly at your own risk.
Past performance is not indicative of future results. Investing involves risk, including the possible loss of principal. All investors should make their own decisions based on their specific investment objectives and financial circumstances.
This site may contain links to external websites that are not provided or maintained by or in any way affiliated with Ryan Mallory and/or SharePlanner. Please note that Ryan Mallory and/or SharePlanner do not guarantee the accuracy, relevance, timeliness, or completeness of any information on these external websites.
By using this website, you agree that Ryan Mallory and/or SharePlanner and any affiliated parties are not responsible for any losses or damages resulting from your use of or reliance on the information provided.
It is strongly recommended that you consult with a qualified professional before making any financial decisions.