The Fourth is Strong with this Market For a moment there, just a moment, it looked like the market was going to lose its marbles and actually experience a legitimate sell-off yesterday. But nope, it didn’t and now you have “May the Fourth” playing Jedi mind tricks on the Wall Street bears in the pre market

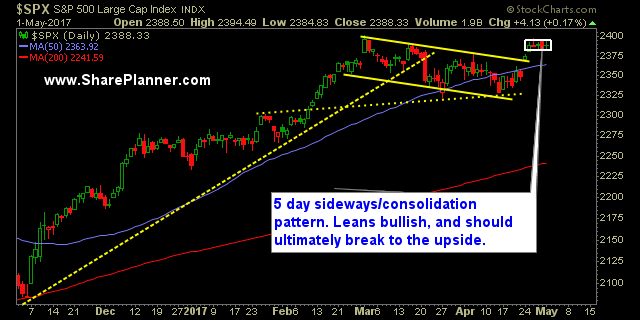
This stock market can’t break out of the range bound price action The price action has become very dull among the indices. In fact, this is the tightest 6-day trading range in the last 23 years. For many of you, that is before you ever started trading. Needless to say, what goes up, must come

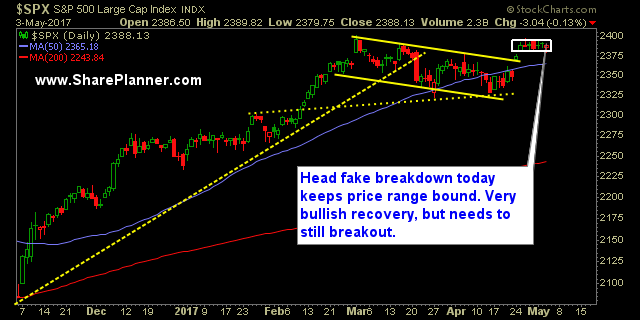
Breakout of Consolidation a Must SPX had that opportunity on Friday to really close out the month strong and breakout of that consolidation pattern that is more evident on the intraday charts than it is on the daily chart. Instead the market gave traders a gap and crap the entire day. Very little bounce and

Nasdaq Rally + Euphoria Knows No Bounds Nasdaq is blowing the roof off this joint and I wish that when you clicked on this post to read, that I could have had Prince singing his infamous "1999" song. It would have been a nice touch and really brought the point home that I'm trying to

Pulled back right before making new all-time highs It has been almost two whole months since we last established new all time highs (3/1) - which really is an eternity in today's Trump-induced market rally. Yesterday, SPX had its chance to do so, the Dow didn't even get close, and the Nasdaq had a hangover

New all time highs is the next step for the market No doubt all this talk about 15% corporate tax cuts are fueling this market run. If you have been short the last two days…my condolences. But trading is going where the market wants to take you, and not being in the backseat strapped in
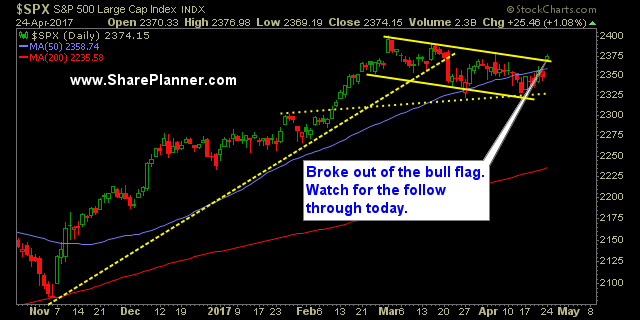
Shockingly the market didn’t sell-off the bull flag in the afternoon and maintained the breakout instead That afternoon sell off has been strong of late, but the bull flag held strong on the charts and the breakout is still in play. Should you be short right now? Not according to the charts. Yes, there

Market breaks out of bull flag on French Election Results Not a bad way to start your week, if you are long on the market (and yes, I am long on the market). It all goes back to what I have been saying in these morning writeups, and that is, the market has been

Watch resistance at the 50 day moving average, take two Everything looked fine and dandy yesterday for the market, and resistance at the 50-day moving average that I talked about in yesterday's trading plan, was going to be broken. But with 10 minutes to go, the bears dropped the S&P 500 5 points and, despite

spc@shareplanner.com
(904) 800-8420
© Copyright 2025 | SharePlanner Inc. All Rights Reserved.
Disclaimer: The information provided on this website is for educational and informational purposes only. Ryan Mallory and/or SharePlanner are not licensed financial advisors, brokers, or tax professionals. The content on this site should not be considered as financial, investment, tax, or legal advice.
All information and opinions expressed herein are based on sources believed to be accurate and reliable. However, we make no representation or warranty as to their accuracy, completeness, or reliability. Any action you take upon the information on this website is strictly at your own risk.
Past performance is not indicative of future results. Investing involves risk, including the possible loss of principal. All investors should make their own decisions based on their specific investment objectives and financial circumstances.
This site may contain links to external websites that are not provided or maintained by or in any way affiliated with Ryan Mallory and/or SharePlanner. Please note that Ryan Mallory and/or SharePlanner do not guarantee the accuracy, relevance, timeliness, or completeness of any information on these external websites.
By using this website, you agree that Ryan Mallory and/or SharePlanner and any affiliated parties are not responsible for any losses or damages resulting from your use of or reliance on the information provided.
It is strongly recommended that you consult with a qualified professional before making any financial decisions.