

The stock market has rallied hard in a short period of time, and that alone is not unusual. What stands out right now is what appears to be driving the move. This does not look like a broad, healthy advance led by widespread participation, steady earnings growth, or normal price discovery. Instead, the rally looks increasingly tied to mechanical options activity, concentrated speculation, and the kind of complacency that often shows up late in major market runs.
That does not mean the market has to top immediately. Bubbles can inflate longer than most traders expect. But it does mean traders should pay close attention to the structure beneath the rally, not just the headline gains in the S&P 500.
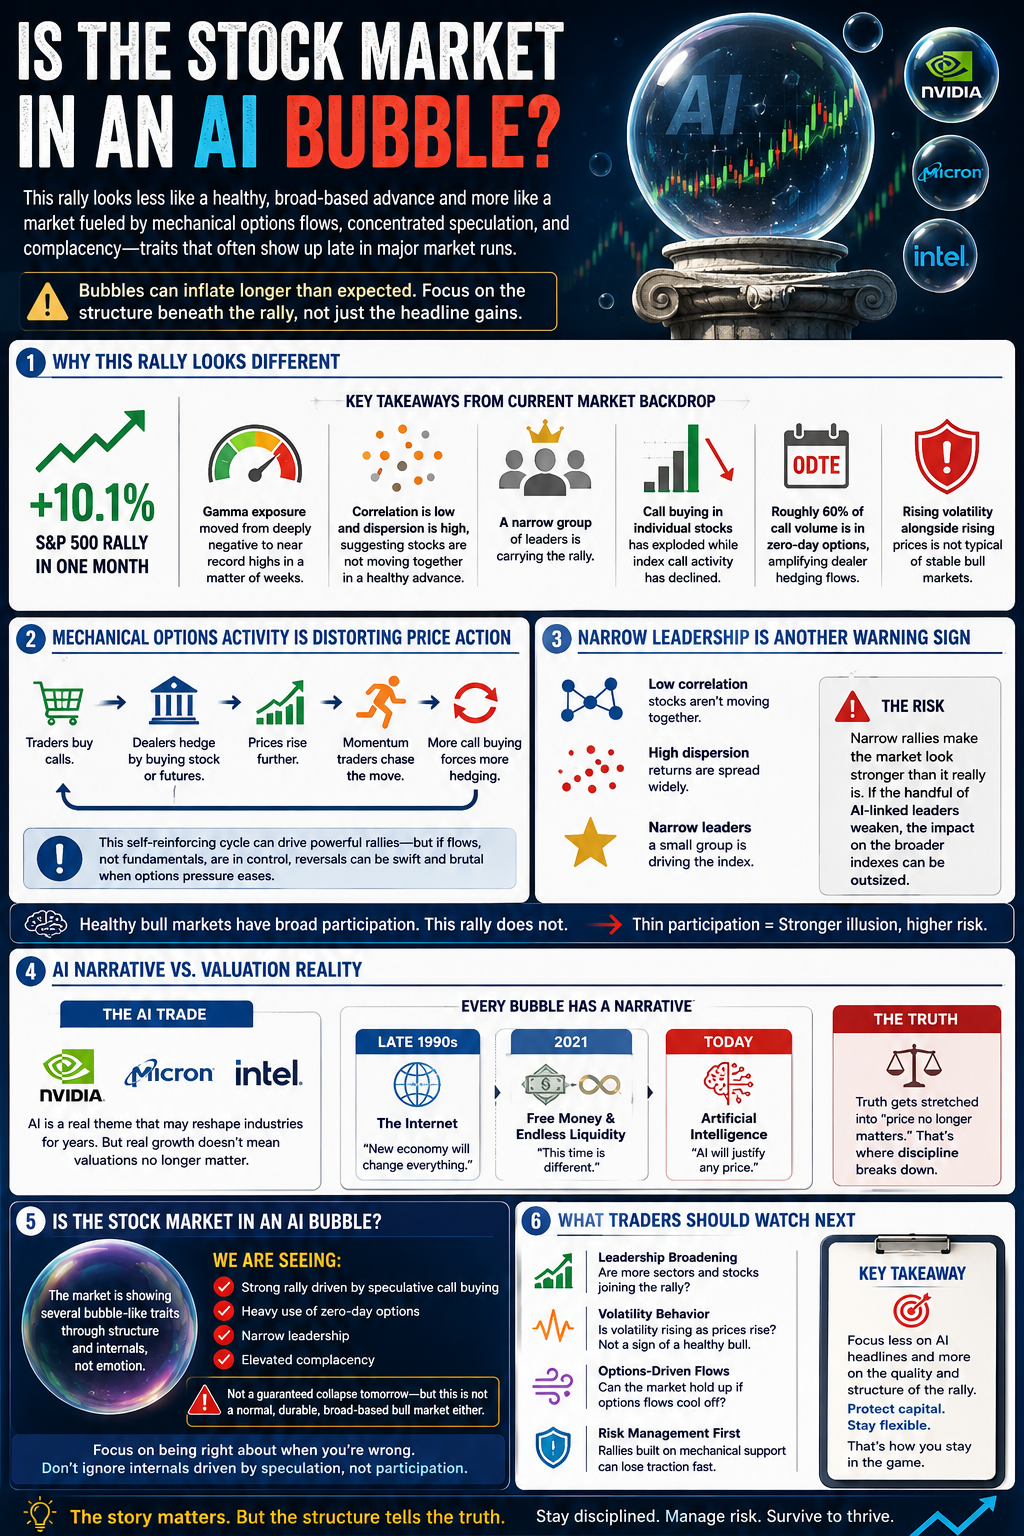
Why This Rally Looks Different
The image lays out the key issue clearly. A +19% rally in the S&P 500 over month and a half is not historically rare. What is more unusual is that the move appears to be happening alongside rising speculation, narrow leadership, and unstable market internals. These kinds of moves are reserved for major market bottoms, not rallies near the top that take it even higher.
The market backdrop points to a rally driven less by broad participation and more by a reflexive loop in options activity. That matters because these types of moves can become self-reinforcing on the way up, but they can also unwind quickly.
Here are the key takeaways from my info chart:
- The S&P 500 has surged almost 19% in just a month and a half.
- Gamma exposure moved from deeply negative to near record highs in a matter of weeks
- Correlation is low and dispersion is high, which suggests stocks are not moving together in a healthy broad advance
- A narrow group of leaders is carrying the rally
- Call buying in individual stocks has exploded while index call activity has declined, seeing average volume levels on SPY drop by 50% in under a month.
- Roughly 60% of call volume is in zero-day options, which can amplify dealer hedging flows
- Rising volatility alongside rising prices is not typical of stable bull markets
Mechanical Options Activity Is Distorting Price Action
One of the clearest warnings from the image is the role of zero-day options and concentrated call buying. This matters because it can create price movement that has more to do with market structure than with business fundamentals.
The basic loop is straightforward. Traders buy calls. Dealers hedge that exposure by buying stock or futures. Prices rise further. Momentum traders then chase the move higher. That brings in more call buying, which forces more hedging. The cycle feeds itself.
This kind of rally can feel powerful and convincing in real time. I have seen traders get pulled into these environments because the price action looks too strong to fight. But if the move is being driven by flows more than by fundamentals, then it can reverse harder than most expect once the options pressure eases. That’s why I’ve avoided chasing the tech rally at these extremes.
Narrow Leadership Is Another Warning Sign
A healthy bull market usually has broad participation. More sectors join in. More stocks make new highs. Leadership expands over time.
That is not what the chart is describing. Instead, it points to low correlation, high dispersion, and narrow leaders doing the lifting. In simple terms, a smaller group of stocks are driving a larger share of the index move. If you don’t believe me, just look at RSP, which is the S&P 500 equal weighted index, that continues to struggle mightily.
This is so important, because narrow rallies can make the overall market look stronger than it really is. If too much of the advance depends on a handful of names tied to the AI trade, then weakness in those names can have an outsized impact on the broader indexes.
This is one reason a lot of your seasoned traders are starting to question this stock market rally, wondering when the house of cards will finally come crashing down. When participation is thin beneath the surface, the rally can feel much stronger than it actually is.
AI Narrative vs. Valuation Reality
Also, worth keeping in mind is the AI trade narrative, with names like Nvidia (NVDA), Micron (MU), and Intel (INTC) at the center of momentum chasing and speculative activity. AI is a real theme. It may reshape industries for years. That part can be true.
What does not automatically follow is that current valuations no longer matter.
This is where market history becomes helpful. The chart compares today’s backdrop with past periods where investors convinced themselves the story justified any price. In the late 1990s, it was the internet. In 2007, it was buying real estate, and flipping homes, and in 2021, it was free money and endless liquidity. Today, it is artificial intelligence.
Every bubble has a narrative. The narrative is usually rooted in something real. The problem starts when that truth gets stretched into the idea that price no longer matters. That is usually where discipline breaks down.
Is the Stock Market in an AI Bubble?
The honest answer is that the market is showing several bubble-like traits and we see that through through structure and internals of the market, not emotion.
We are seeing a strong rally driven by speculative call buying, heavy use of zero-day options, narrow leadership, and elevated complacency. Those are not the classic building blocks of a durable, broad-based bull market. They are more consistent with a market that is becoming increasingly dependent on momentum and mechanical flows.
That does not mean a collapse is guaranteed tomorrow. It does mean traders should be careful about assuming this is a normal rally that can be trusted without question.
If the market internals are being driven by speculation instead of participation, that is not something to ignore.
What Traders Should Watch Next
If you are trying to navigate this market, focus less on the excitement around AI headlines and more on the quality of the rally itself. Watch whether leadership broadens, whether volatility starts rising further as prices rise, and whether the market can hold up if options-driven flows cool off.
A rally that depends too heavily on mechanical support can lose traction fast once that support is removed. That is why risk management matters most in environments like this.
FAQ
What is an AI bubble in the stock market?
An AI bubble is a market environment where stocks linked to artificial intelligence become excessively inflated due to speculation, momentum, and narrative-driven buying rather than sustainable fundamentals.
Why does options activity matter in this rally?
Heavy call buying, especially in zero-day options, can force dealers to hedge by buying stock. That hedging can push prices higher and create a feedback loop that fuels the rally.
Is a 10% rally in one month unusual?
Not by itself. The concern is not the size of the rally alone. The concern is that the rally appears to be driven by narrow leadership, speculative flows, and unstable market structure.
What does narrow market leadership mean?
It means only a small group of stocks is responsible for most of the market’s gains. That can make the indexes look healthier than the overall market actually is.
Can the market keep rising even if it is in a bubble?
Yes. Bubbles can continue longer than expected. That is why traders should avoid guessing tops and instead focus on risk management, participation, and market structure.
What are the main warning signs shown in the chart?
The main warning signs are concentrated call buying, near-record gamma exposure, narrow leadership, low correlation, high dispersion, and rising volatility during a sharp rally.


Welcome to Swing Trading the Stock Market Podcast!
I want you to become a better trader, and you know what? You absolutely can!
Commit these three rules to memory and to your trading:
#1: Manage the RISK ALWAYS!
#2: Keep the Losses Small
#3: Do #1 & #2 and the profits will take care of themselves.
That’s right, successful swing-trading is about managing the risk, and with Swing Trading the Stock Market podcast, I encourage you to email me (ryan@shareplanner.com) your questions, and there’s a good chance I’ll make a future podcast out of your stock market related question.
Refusing to take a loss when the trade has turned, and the reason for getting into the trade in the first place is no longer valid, is one of the biggest problems traders face. In this video, Ryan Mallory discusses the pitfalls that comes with refusing to take the loss and instead opting to become a bagholder on one's trades.
Be sure to check out my Swing-Trading offering through SharePlanner that goes hand-in-hand with my podcast, offering all of the research, charts and technical analysis on the stock market and individual stocks, not to mention my personal watch-lists, reviews and regular updates on the most popular stocks, including the all-important big tech stocks. Check it out now at: https://www.shareplanner.com/premium-plans
📈 START SWING-TRADING WITH ME! 📈
Click here to subscribe: https://shareplanner.com/tradingblock
— — — — — — — — —
💻 STOCK MARKET TRAINING COURSES 💻
Click here for all of my training courses: https://www.shareplanner.com/trading-academy
– The A-Z of the Self-Made Trader –https://www.shareplanner.com/the-a-z-of-the-self-made-trader
– The Winning Watch-List — https://www.shareplanner.com/winning-watchlist
– Patterns to Profits — https://www.shareplanner.com/patterns-to-profits
– Get 1-on-1 Coaching — https://www.shareplanner.com/coaching
— — — — — — — — —
❤️ SUBSCRIBE TO MY YOUTUBE CHANNEL 📺
Click here to subscribe: https://www.youtube.com/shareplanner?sub_confirmation=1
🎧 LISTEN TO MY PODCAST 🎵
Click here to listen to my podcast: https://open.spotify.com/show/5Nn7MhTB9HJSyQ0C6bMKXI
— — — — — — — — —
💰 FREE RESOURCES 💰
— — — — — — — — —
🛠 TOOLS OF THE TRADE 🛠
Software I use (TC2000): https://bit.ly/2HBdnBm
— — — — — — — — —
📱 FOLLOW SHAREPLANNER ON SOCIAL MEDIA 📱
FACEBOOK: https://facebook.com/shareplanner
*Disclaimer: Ryan Mallory is not a financial adviser and this podcast is for entertainment purposes only. Consult your financial adviser before making any decisions.

You Might Like

South Korea: The Hidden Driver of US Tech Volatility

Stop Trying to Hit Home Runs: Start Trading Within Your Means

How to Trade Breakouts Without Getting Trapped