
Stock market winning streak hits the 7th straight day! And this stock market winning streak comes after a 4 day sell-off, and just just a couple of weeks later, the market have finished off an 8 day winning streak. It kind of feels like this market is beholden to nothing but streaks these days and

Another low volume day for the market with anticipated 50bps rate cut from FOMC on Wednesday Even with the expectations now of a 50 basis point rate cut on Wednesday, the trading environment today was entirely boring and uneventful. It’s the quiet period for Fed speakers right now, so you’re not going to get any

The S&P 500 is back to testing all-time highs yet again! It was just two weeks ago the market was doing the same thing it did today – run it higher right into the close and testing all-time highs but not breaking through. The following shortened week, it sold off four straight days, but this

Recent indicators suggest that economic activity has continued to expand at a solid pace. Job gains have moderated, and the unemployment rate has moved up but remains low. Inflation has eased over the past year but remains somewhat elevated. In recent months, there has been some further progress toward the Committee’s 2 percent inflation objective.
-
Recent indicators suggest that economic activity has continued to expand at a solid pace. Job gains have remained strong, and the unemployment rate has remained low. Inflation has eased over the past year but remains elevated. In recent months, there has been a lack of further progress toward the Committee’s 2 percent inflation objective.
-
Recent indicators suggest that economic activity has been expanding at a solid pace. Job gains have remained strong, and the unemployment rate has remained low. Inflation has eased over the past year but remains elevated.

How to Spot Bull Flag Patterns for Profitable Trading Are you looking to improve your profitability and swing trading results by learning how to spot and trade bull flag patterns? Bull flag patterns are one of the most reliable and profitable chart patterns for swing traders. For me personally, it is my favorite continuation pattern.
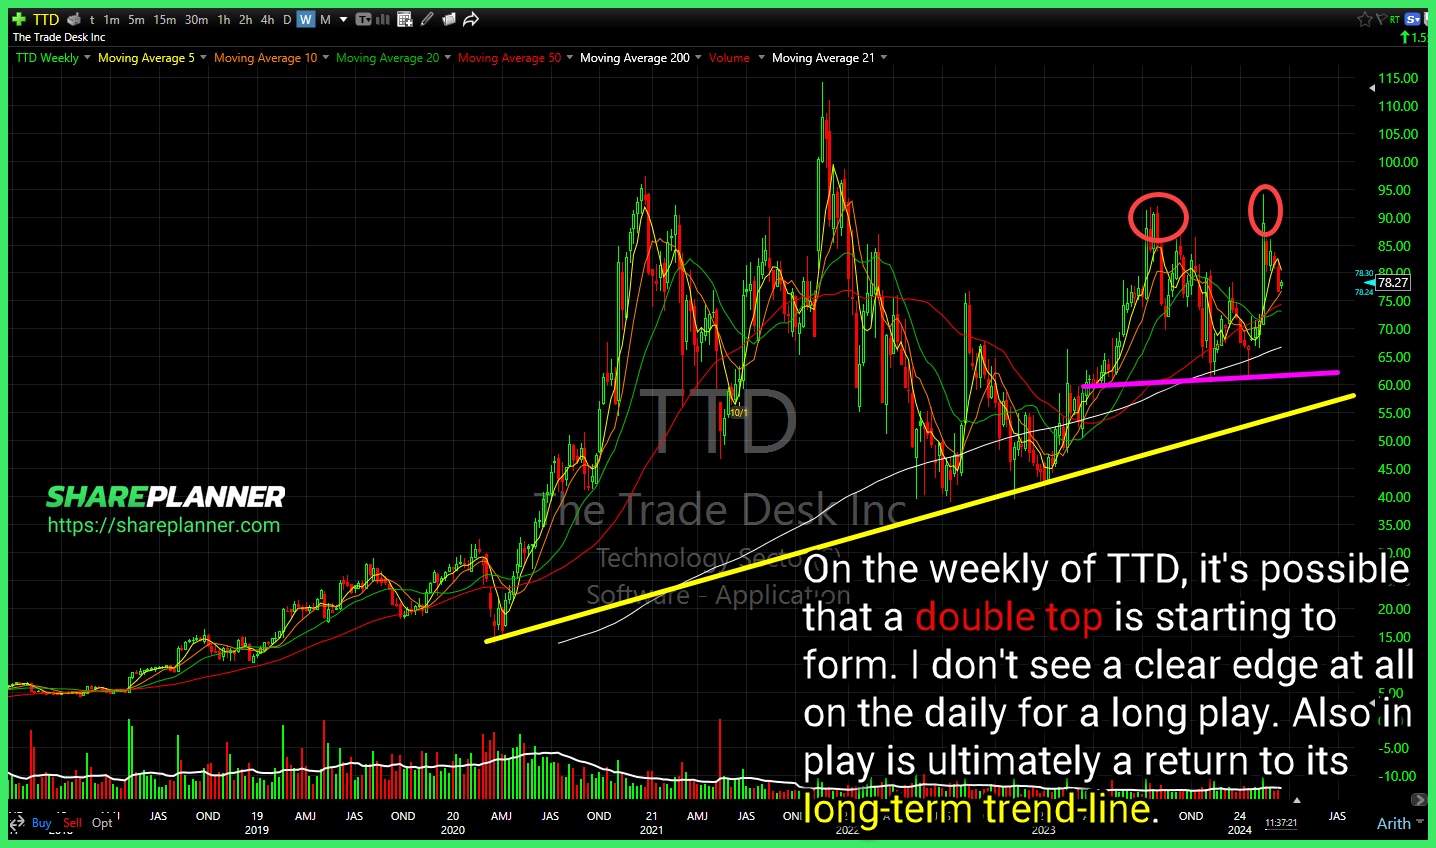
The Trade Desk (TTD) on the weekly chart, it's possible that a double top is starting to form. I don't see a clear edge at all on the daily for a long play. Also in play is ultimately a return to its long-term trend-line. Atlassian (TEAM) retesting the rising trend-line again, but doing so without
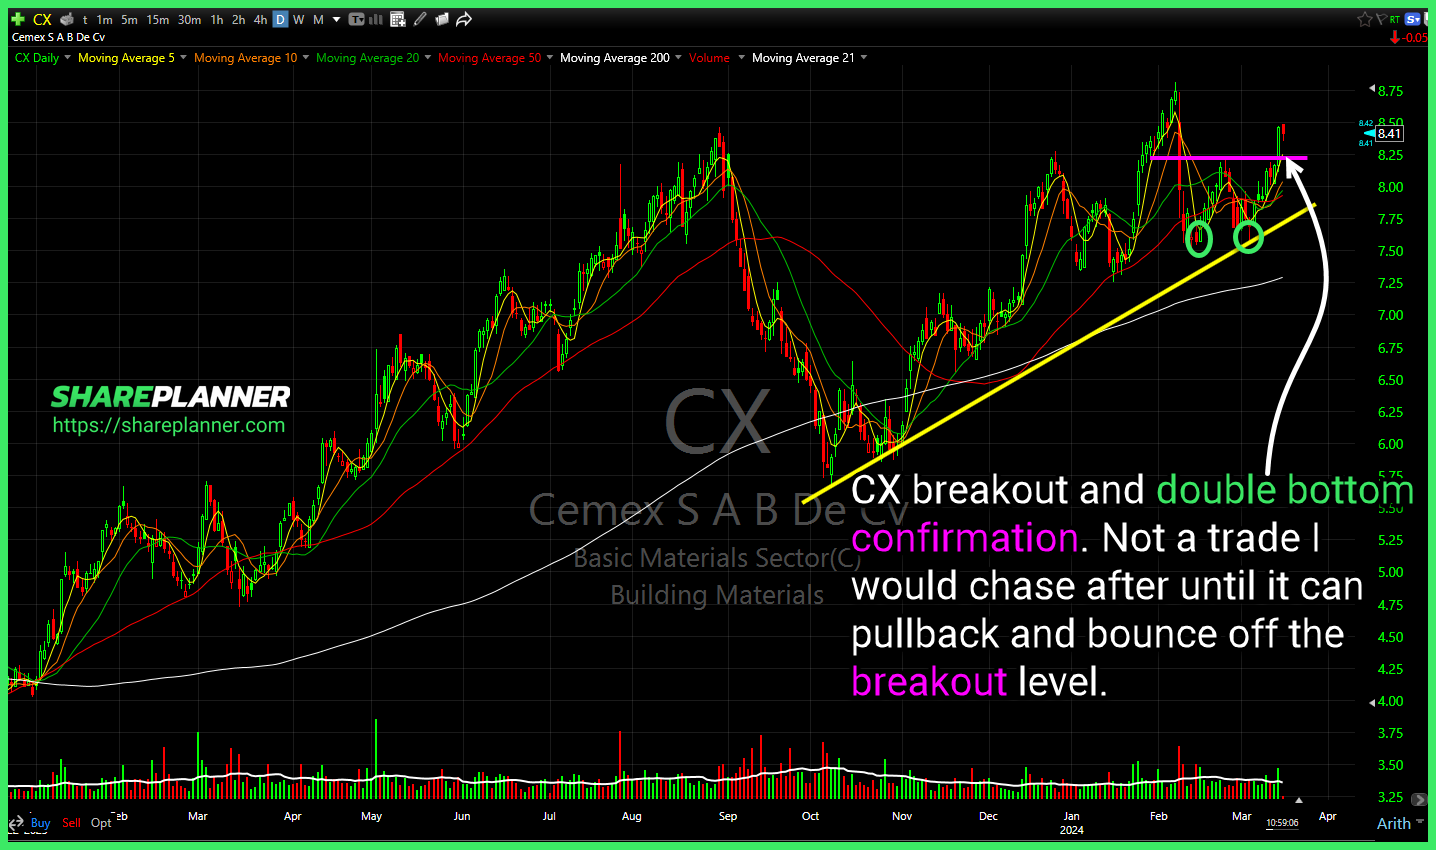
Cemex (CX) breakout and double bottom confirmation. Not a trade I would chase after until it can pullback and bounce off the breakout level. Microsoft (MSFT) with a pullback to the breakout level. Extreme volume at the open though is concerning that it will be able to hold. Could see a pullback to the rising
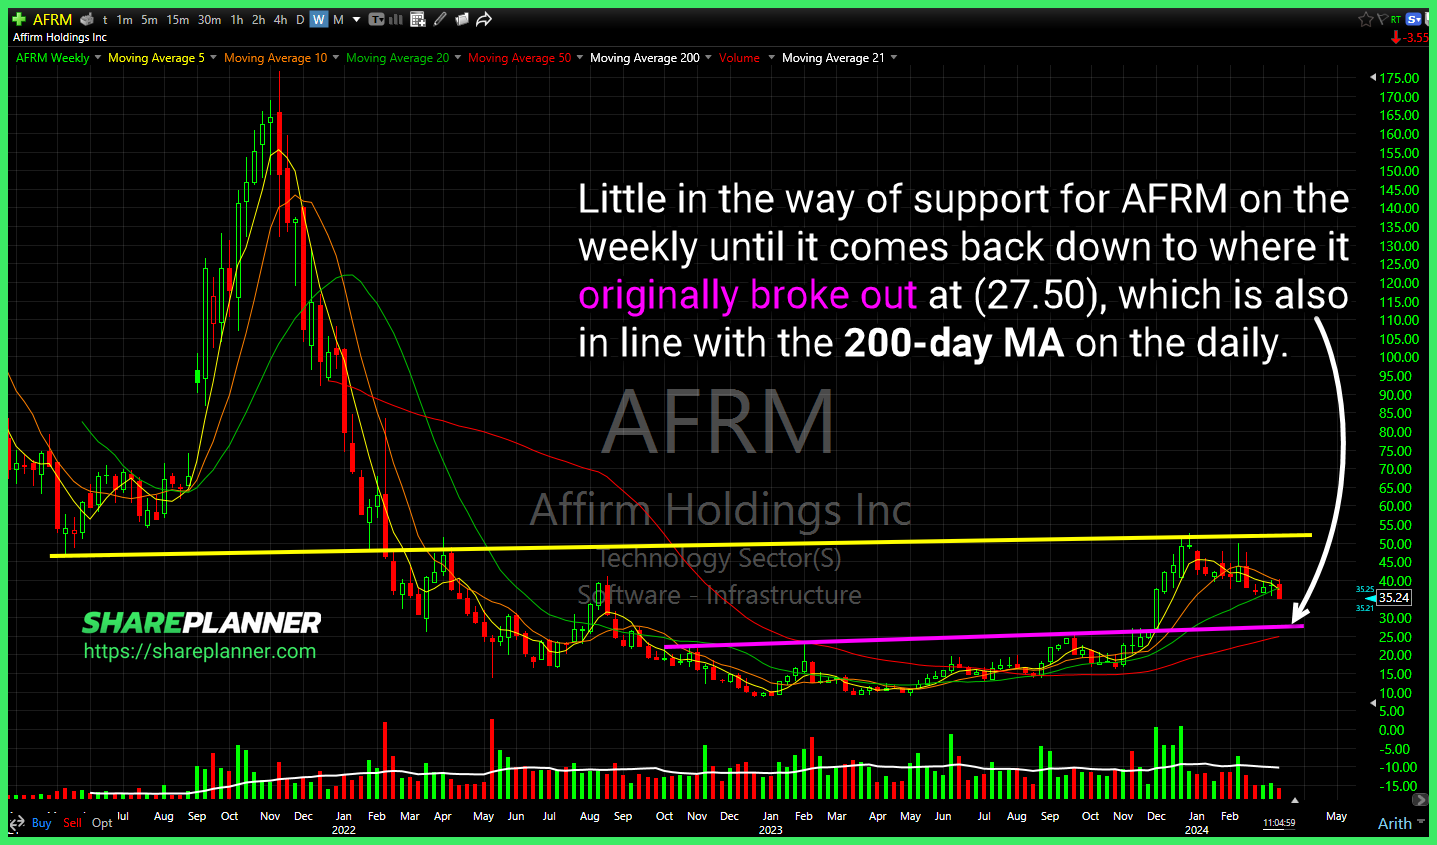
Little in the way of support for Affirm (AFRM) on the weekly until it comes back down to where it originally broke out at (27.50), which is also in line with the 200-day MA on the daily. Compelling bounce play here in Apple (AAPL) if it weren't for the declining resistance just above. Better to

spc@shareplanner.com
(904) 800-8420
© Copyright 2025 | SharePlanner Inc. All Rights Reserved.
Disclaimer: The information provided on this website is for educational and informational purposes only. Ryan Mallory and/or SharePlanner are not licensed financial advisors, brokers, or tax professionals. The content on this site should not be considered as financial, investment, tax, or legal advice.
All information and opinions expressed herein are based on sources believed to be accurate and reliable. However, we make no representation or warranty as to their accuracy, completeness, or reliability. Any action you take upon the information on this website is strictly at your own risk.
Past performance is not indicative of future results. Investing involves risk, including the possible loss of principal. All investors should make their own decisions based on their specific investment objectives and financial circumstances.
This site may contain links to external websites that are not provided or maintained by or in any way affiliated with Ryan Mallory and/or SharePlanner. Please note that Ryan Mallory and/or SharePlanner do not guarantee the accuracy, relevance, timeliness, or completeness of any information on these external websites.
By using this website, you agree that Ryan Mallory and/or SharePlanner and any affiliated parties are not responsible for any losses or damages resulting from your use of or reliance on the information provided.
It is strongly recommended that you consult with a qualified professional before making any financial decisions.