
For those looking to swing trade this market, I think it is important to read Adam’s post from earlier today, as we are consolidating/coiling in a tightening range each day. Instead of trying to predict which direction this market is going to go (and I don’t care how good of a trader one says he/she
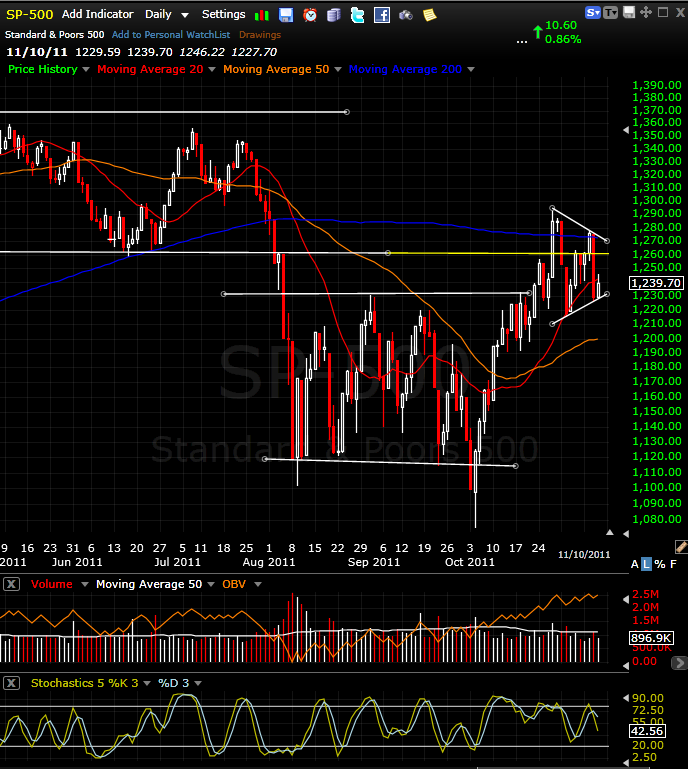
SPX forming a nice flag as the bulls and bears fight for control of this market. We've bounced nicely off the bottom of the flag. Question now is do we bounce back to the top or break down below it?
Over the past few weeks, I have been unusally quiet on the site; only a few posts and limited in my participation in the chat-room. During that time, I was working on some site improvements, and by now you may have seen some of those changes emerge. I wanted to make an official post out
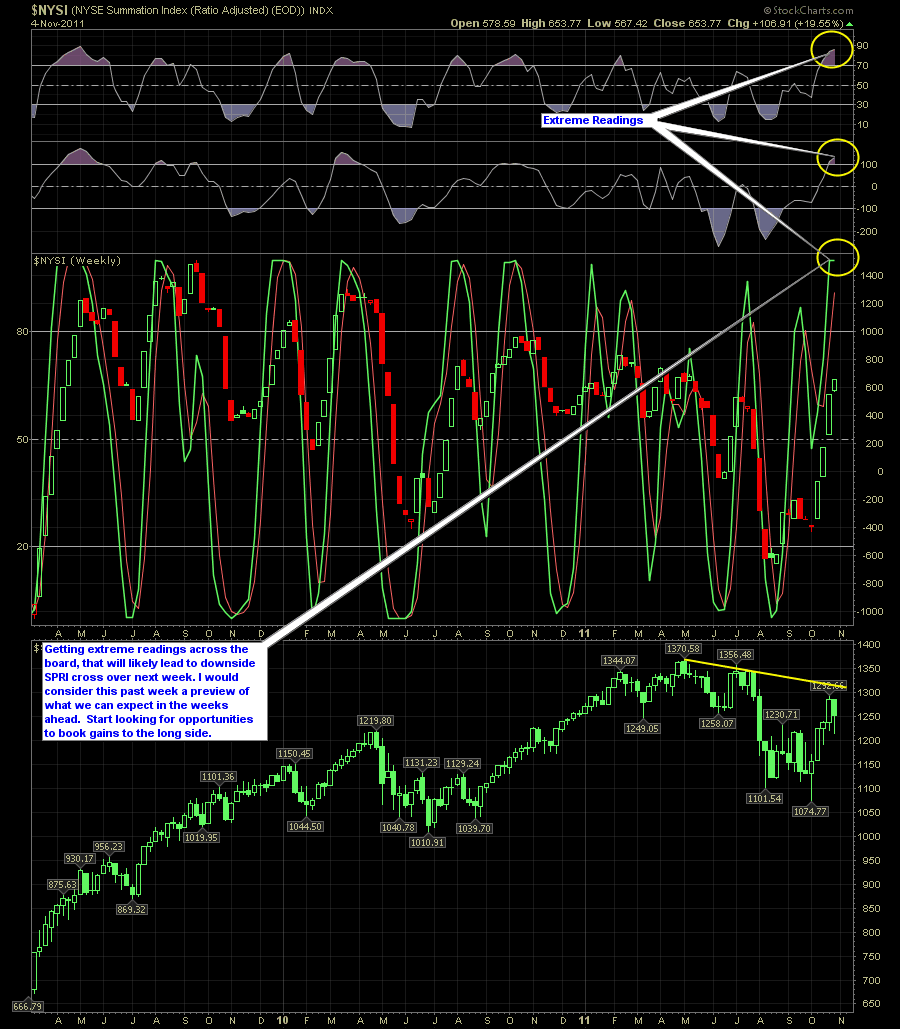
It’s been a hectic couple of weeks in the stock market recently and based on the indicator below, we are reaching a point where, as traders, we need to look for places to start booking gains on our long positions. You have some news after the close on Friday about another CME notice that raises
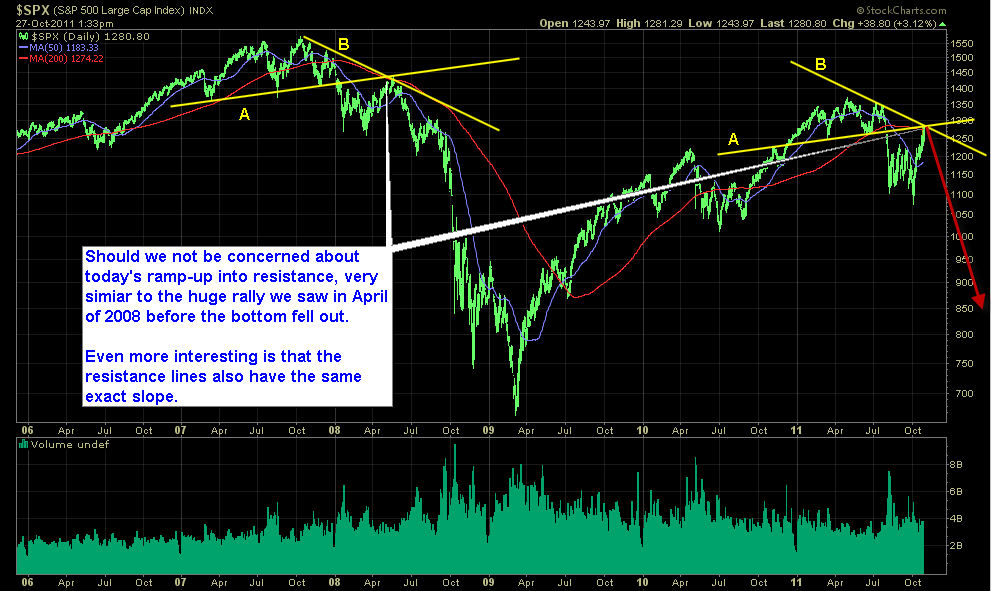
Should we be concerned by the current state of the market? Simple trend-lines would dictate a resounding "YES".
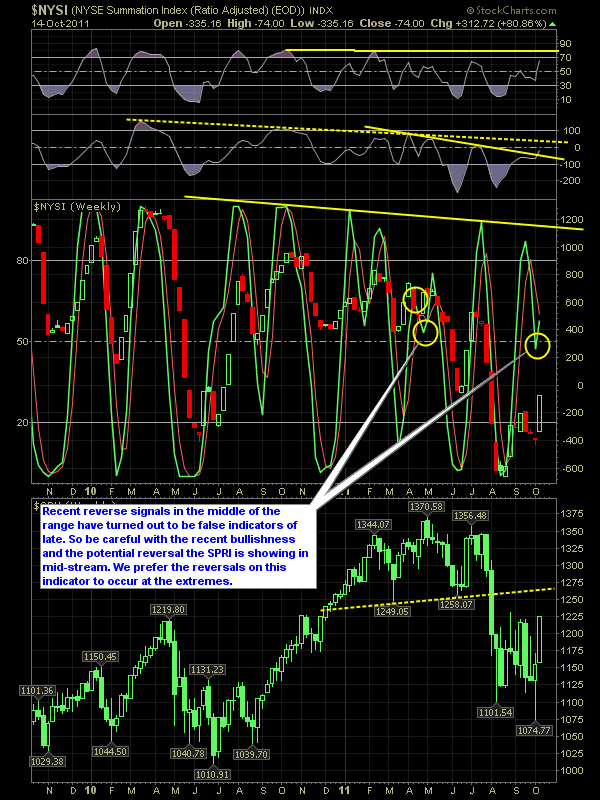
Those who continue to hold their long positions over the course of the last two weeks, I congratulate you. I have to admit, I am a bit skeptical of this rally, but then again, if you look at March of 2009, we saw a similar rally take place over the course of about four weeks
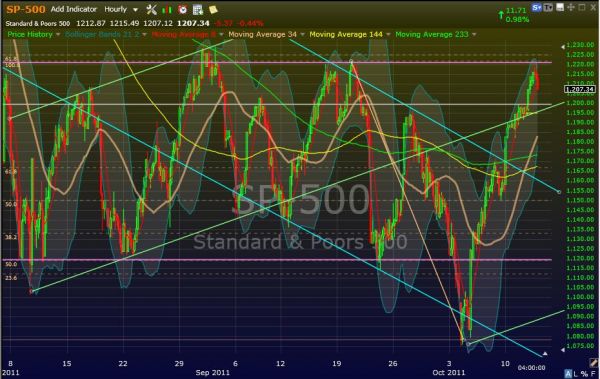
The S&P bounced be-YOO-tifully against the old, upper Fibo level I talked about yesterday. If you didn't read that one, it's the two horizontal pink lines that represent at 61.8% and 50% retrace level from the 2008 high to the 2009 low. This also coincides with my personal bias that this markets is slowly retracing
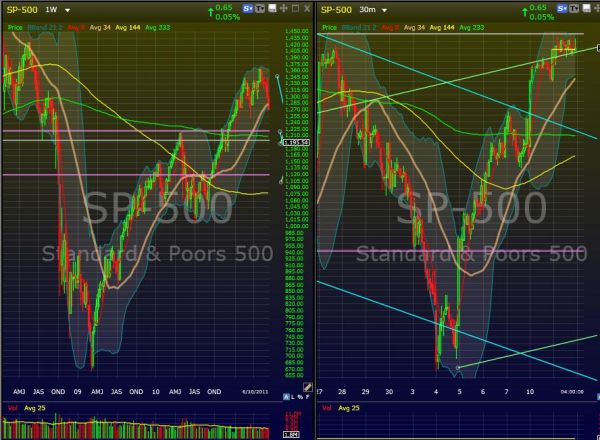
Look at the side-by-side chart below and see if you see any similarities. Is this what a V-shaped Recovery looks like? While looking at 30-min and hourly charts of IWM and the S&P, I thought I noticed a familiar pattern. The left chart is the weekly S&P of late 2008 through 2010, right before the

Here is a quick recap of what we saw in the market today and what we expect. Today we pretty much had a trend day. Market runs up quickly in the morning and begins to move sideways for the remainder of the day. This a great thing if you are long from yesterday but if

The market did what few people expected this week and that was to go on an incredible tear to the upside, forcing a lot of bears to cover their short positions and incur some heavy losses in the process. In fact, most charts out there that I’ve been going over are, for the most part,

spc@shareplanner.com
(904) 800-8420
© Copyright 2025 | SharePlanner Inc. All Rights Reserved.
Disclaimer: The information provided on this website is for educational and informational purposes only. Ryan Mallory and/or SharePlanner are not licensed financial advisors, brokers, or tax professionals. The content on this site should not be considered as financial, investment, tax, or legal advice.
All information and opinions expressed herein are based on sources believed to be accurate and reliable. However, we make no representation or warranty as to their accuracy, completeness, or reliability. Any action you take upon the information on this website is strictly at your own risk.
Past performance is not indicative of future results. Investing involves risk, including the possible loss of principal. All investors should make their own decisions based on their specific investment objectives and financial circumstances.
This site may contain links to external websites that are not provided or maintained by or in any way affiliated with Ryan Mallory and/or SharePlanner. Please note that Ryan Mallory and/or SharePlanner do not guarantee the accuracy, relevance, timeliness, or completeness of any information on these external websites.
By using this website, you agree that Ryan Mallory and/or SharePlanner and any affiliated parties are not responsible for any losses or damages resulting from your use of or reliance on the information provided.
It is strongly recommended that you consult with a qualified professional before making any financial decisions.