
Those who continue to hold their long positions over the course of the last two weeks, I congratulate you. I have to admit, I am a bit skeptical of this rally, but then again, if you look at March of 2009, we saw a similar rally take place over the course of about four weeks without the slightest of pullbacks. The price on the S&P has managed to break the downward trend of late, and as a result, it tells me that the market is finally starting to regain its footing. However, chasing price at these levels could be a fool’s game until we get some kind of consolidation or pullback in price.
For those of you who are not familiar with the SharePlanner Reversal Indicator, here’s a quick tutorial…
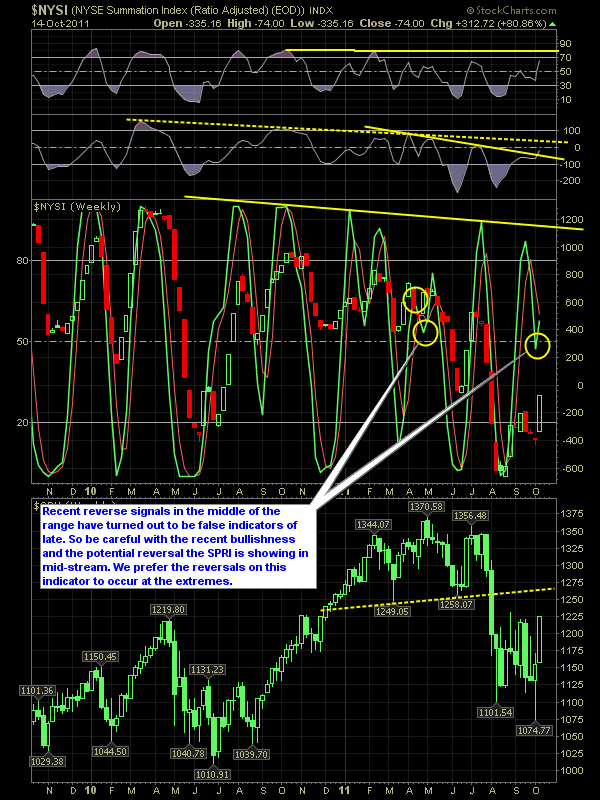
The Indicator uses the advance/decline ratio with a stochastics overlay. The bottom half of the chart is the weekly candles of the S&P. The chart itself goes back two years. Some folks have criticized me for posting this chart in the past saying that it isn’t 100% accurate – but if it was, as some think it must be, then I wouldn’t be posting it – I’d save it all for myself and make an ungodly sum of money off of it. But it isn’t perfect and there is always a level of error that you can expect from it. But overall, it is fairly accurate, and when the indicator hits certain extremes on the stochastics, it is often a good time to start hedging positions that are going against the direction of the indicators, or start loading up on short or long positions in-line with the direction that the indicator itself is pointing to.
Remember, the extremes are where you are wanting to pay the closest attention to, particularly where the %K & %D lines cross (i.e the red and green lines). This is typically where we begin to see changes in the behavior of the market – not always but quite often enough, to warrant our attention. What this tool is best for, in terms of what I use it for, is market timing and position building. When there is a crossover at one of the extremes that goes against the positions in my portfolio, I, often times, look to take profits in those positions or at least hedge against them
Here is the SharePlanner Reversal Indicator.


Welcome to Swing Trading the Stock Market Podcast!
I want you to become a better trader, and you know what? You absolutely can!
Commit these three rules to memory and to your trading:
#1: Manage the RISK ALWAYS!
#2: Keep the Losses Small
#3: Do #1 & #2 and the profits will take care of themselves.
That’s right, successful swing-trading is about managing the risk, and with Swing Trading the Stock Market podcast, I encourage you to email me (ryan@shareplanner.com) your questions, and there’s a good chance I’ll make a future podcast out of your stock market related question.
Watching the dollars rise and fall in your trading account can turn a well-planned swing trade into an emotional, deeply personal decision. In this episode, I explain why focusing on price action, percentage returns, and R-multiples can help you avoid cutting winners early, holding losers too long, and abandoning your trading plan.
Be sure to check out my Swing-Trading offering through SharePlanner that goes hand-in-hand with my podcast, offering all of the research, charts and technical analysis on the stock market and individual stocks, not to mention my personal watch-lists, reviews and regular updates on the most popular stocks, including the all-important big tech stocks. Check it out now at: https://www.shareplanner.com/premium-plans
📈 START SWING-TRADING WITH ME! 📈
Click here to subscribe: https://shareplanner.com/tradingblock
— — — — — — — — —
💻 STOCK MARKET TRAINING COURSES 💻
Click here for all of my training courses: https://www.shareplanner.com/trading-academy
– The A-Z of the Self-Made Trader –https://www.shareplanner.com/the-a-z-of-the-self-made-trader
– The Winning Watch-List — https://www.shareplanner.com/winning-watchlist
– Patterns to Profits — https://www.shareplanner.com/patterns-to-profits
– Get 1-on-1 Coaching — https://www.shareplanner.com/coaching
— — — — — — — — —
❤️ SUBSCRIBE TO MY YOUTUBE CHANNEL 📺
Click here to subscribe: https://www.youtube.com/shareplanner?sub_confirmation=1
🎧 LISTEN TO MY PODCAST 🎵
Click here to listen to my podcast: https://open.spotify.com/show/5Nn7MhTB9HJSyQ0C6bMKXI
— — — — — — — — —
💰 FREE RESOURCES 💰
— — — — — — — — —
🛠 TOOLS OF THE TRADE 🛠
Software I use (TC2000): https://bit.ly/2HBdnBm
— — — — — — — — —
📱 FOLLOW SHAREPLANNER ON SOCIAL MEDIA 📱
*Disclaimer: Ryan Mallory is not a financial adviser and this podcast is for entertainment purposes only. Consult your financial adviser before making any decisions.

You Might Like

South Korea: The Hidden Driver of US Tech Volatility

Stop Trying to Hit Home Runs: Start Trading Within Your Means

How to Trade Breakouts Without Getting Trapped