
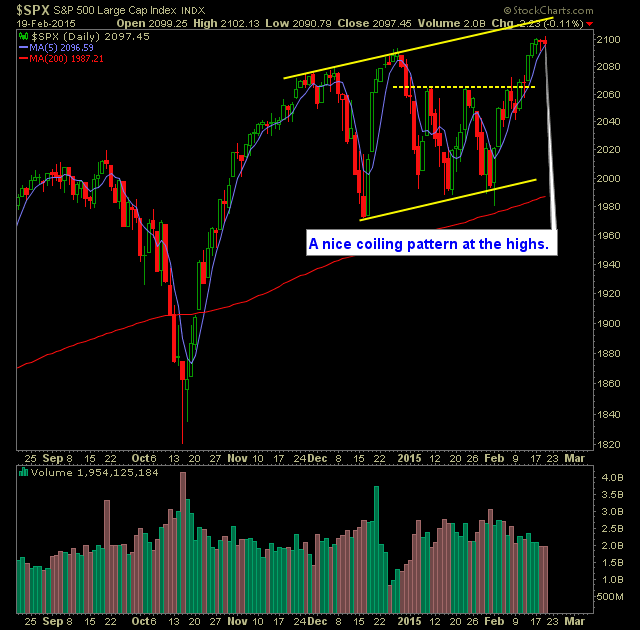
Technical Outlook (SPX):
- SPX has coiled for the past three days at the all-time highs.
- In the process it has done a fantastic job of holding on to the 5-day moving average.
- SPX 30 minute chart shows a nice trading range between 2088 and 2101. A break below or above will go a long way in determining short-term direction for this market.
- Greece is again in the headlines this morning with no deal yet reached.
- Technically speaking, SPX daily chart is starting to form a bull flag.
- A pullback on SPX would not be able to drop below 2065 level without threatening key price support and the integrity of the current uptrend.
- The previous three trading sessions has seen price pullback intraday – only for the dip-buyers to come back immediately and hold price right at the all-time highs.
- VIX dropped 1% down to 15.29.
- No notable changes in volume levels – overall it has been a very low-volume week of trading.
- Upper channel resistance is now at 2124.
- Russell breakout out perfectly above the box range it has been in for over a year now.
- Weekly SPX chart shows a well constructed bullish-flag breakout taking place.
- Monthly looks equally impressive.
- Oil remains extremely volatile and becoming more so each and every day. Very difficult to trade – as are the oil stocks.
- The market doesn’t care about the economy nor earnings. That is not what is driving it. The market only cares about what the Fed is doing to keep equities propped up.
My Trades:
- Did not add any new positions yesterday.
- Did not close out any positions yesterday .
- 60% Long / 40% cash.
- Remain long HON at 102.48, ADBE at 73.66, MA at 86.29, MSFT at 43.03, BA at 149.84, LULU at 66.74.
- Join me each day for all my real-time trades and alerts in the SharePlanner Splash Zone
Chart for SPX:


Welcome to Swing Trading the Stock Market Podcast!
I want you to become a better trader, and you know what? You absolutely can!
Commit these three rules to memory and to your trading:
#1: Manage the RISK ALWAYS!
#2: Keep the Losses Small
#3: Do #1 & #2 and the profits will take care of themselves.
That’s right, successful swing-trading is about managing the risk, and with Swing Trading the Stock Market podcast, I encourage you to email me (ryan@shareplanner.com) your questions, and there’s a good chance I’ll make a future podcast out of your stock market related question.
In this podcast episode, Ryan discusses how really bad, losing trades in the stock market creates an impossible scenario for the trader in terms of what the right decision should be.
Be sure to check out my Swing-Trading offering through SharePlanner that goes hand-in-hand with my podcast, offering all of the research, charts and technical analysis on the stock market and individual stocks, not to mention my personal watch-lists, reviews and regular updates on the most popular stocks, including the all-important big tech stocks. Check it out now at: https://www.shareplanner.com/premium-plans
📈 START SWING-TRADING WITH ME! 📈
Click here to subscribe: https://shareplanner.com/tradingblock
— — — — — — — — —
💻 STOCK MARKET TRAINING COURSES 💻
Click here for all of my training courses: https://www.shareplanner.com/trading-academy
– The A-Z of the Self-Made Trader –https://www.shareplanner.com/the-a-z-of-the-self-made-trader
– The Winning Watch-List — https://www.shareplanner.com/winning-watchlist
– Patterns to Profits — https://www.shareplanner.com/patterns-to-profits
– Get 1-on-1 Coaching — https://www.shareplanner.com/coaching
— — — — — — — — —
❤️ SUBSCRIBE TO MY YOUTUBE CHANNEL 📺
Click here to subscribe: https://www.youtube.com/shareplanner?sub_confirmation=1
🎧 LISTEN TO MY PODCAST 🎵
Click here to listen to my podcast: https://open.spotify.com/show/5Nn7MhTB9HJSyQ0C6bMKXI
— — — — — — — — —
💰 FREE RESOURCES 💰
— — — — — — — — —
🛠 TOOLS OF THE TRADE 🛠
Software I use (TC2000): https://bit.ly/2HBdnBm
— — — — — — — — —
📱 FOLLOW SHAREPLANNER ON SOCIAL MEDIA 📱
FACEBOOK: https://facebook.com/shareplanner
*Disclaimer: Ryan Mallory is not a financial adviser and this podcast is for entertainment purposes only. Consult your financial adviser before making any decisions.
You Might Like

South Korea: The Hidden Driver of US Tech Volatility

Stop Trying to Hit Home Runs: Start Trading Within Your Means

How to Trade Breakouts Without Getting Trapped