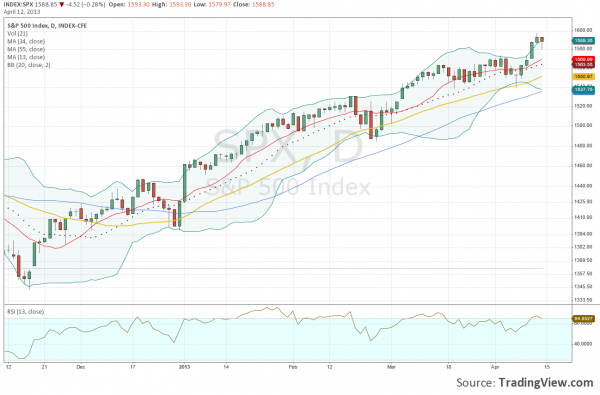
Remember how April started with a correction scare after the S&P reached new highs? There were rumors of 5% corrections down to 1450 sprinkled in with the 5-15 minute reminders on the financial news channel that we are, or were just a moment ago, at record highs. Then, the pullback continued into a blowoff bottom
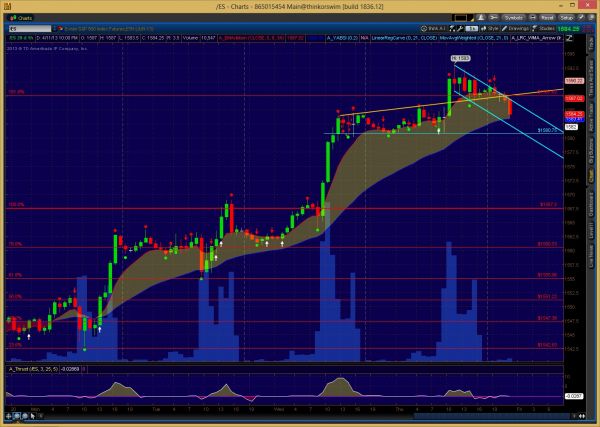
I've been spending some time playing with TOS programming to create and customize my own indicators. A slick cloud effect should help to better visualize price direction, and a "Thrust Rating" of my own creation to qualify trends and surges. I'm looking forward to using Thrust to better time my entries into these ridiculous morning
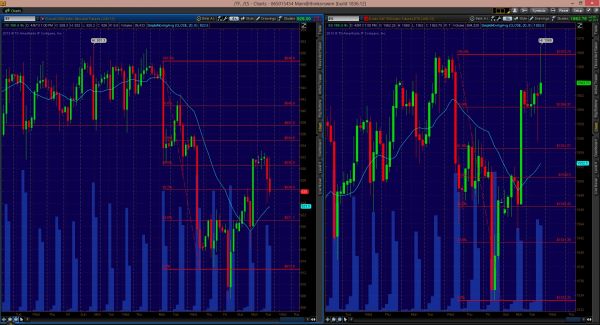
What? 2.2% drop in S&P futures from alltime highs in three days? Well how ’bout we just fix that back in two? My morning prediction of ending the Christmas Parade of red-green candles came true with two greens taking /ES to new (intraday) highs. I’m glad I didn’t have CNBC in case they pulled

Reversal Indicator shows any pullback will be small Even though I view the economy to be a royal mess and in my personal opinion and my belieft that the true value of the market should be no more than 2/3’s of current value since the current value of the market is only as a result
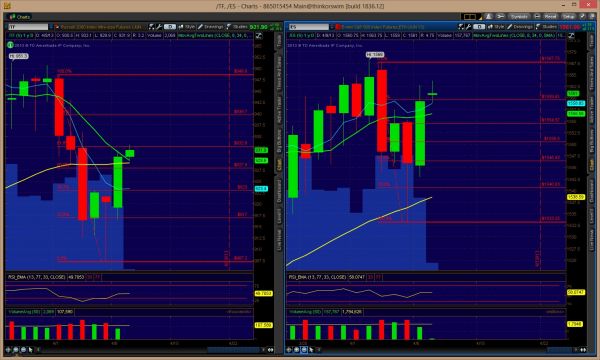
Looks like the 3:30-4:00 pm Daily Ramp has saved the /ES back to support-only mode, with only that record high standing in the way to continued wealth effect for the consumers of America. We'll ignore, of course, the low volume of that HUGE green candle from yesterday. Volume doesn't seem to matter anymore, only buying.

Christmas in April… Quick Glance at the Market Heat Map and Industries Notables: Not a clean day for the technology sector Utilities and Conglomerates were solid. Banks and materials, outside of a couple big names, held their own. Be sure to check out my latest swing trades and overall past performance
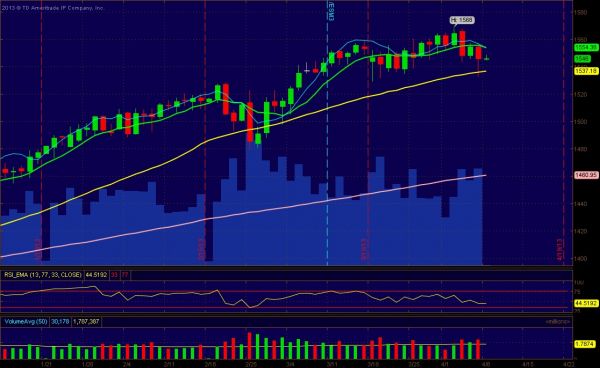
The Christmas-like red-green red-green candles continue on. The /ES this evening is starting out as a little green doji, but should end the day green if the ABAB pattern continues. The short-term trend is down, but Friday’s panic sell bounced roughly around my long-term uptrend.

Pre-market update (updated 9am eastern): European markets are trading -1.8% lower. Asian markets traded in a very wide and mixed range – down on average -0.5%. US futures are down in excess of 20 points on the S&P ahead of the open. Economic reports due out (all times are eastern): Employment Situation (8:30am), International Trade
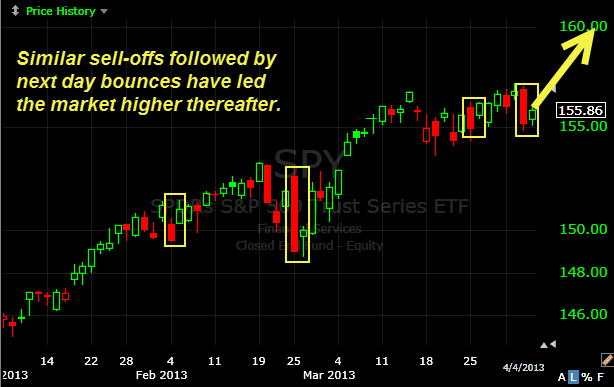
A silver lining in the action from the last two days Quick Glance at the Market Heat Map and Industries Notables: Banks recovered for the most part. Apple down, market up. Utilities were consistent across the board, materials still struggling to find footing. Be sure to check out my latest swing
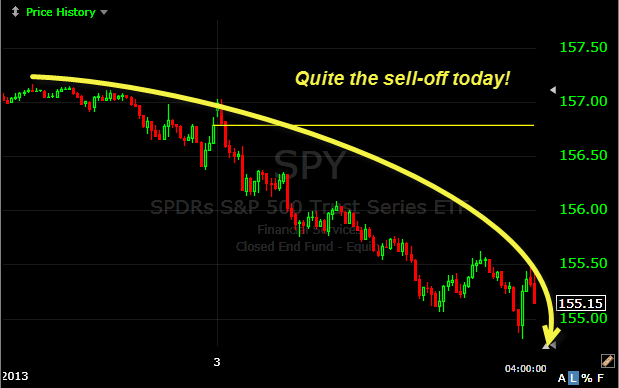
Yup, there are still a such thing as sell-offs… Quick Glance at the Market Heat Map and Industries Notables: Of course Apple was up on the day the market had a mass sell-off. The banks were by far the disaster in today’s market. Basic materials still piling on the losses. Be

spc@shareplanner.com
(904) 800-8420
© Copyright 2025 | SharePlanner Inc. All Rights Reserved.
Disclaimer: The information provided on this website is for educational and informational purposes only. Ryan Mallory and/or SharePlanner are not licensed financial advisors, brokers, or tax professionals. The content on this site should not be considered as financial, investment, tax, or legal advice.
All information and opinions expressed herein are based on sources believed to be accurate and reliable. However, we make no representation or warranty as to their accuracy, completeness, or reliability. Any action you take upon the information on this website is strictly at your own risk.
Past performance is not indicative of future results. Investing involves risk, including the possible loss of principal. All investors should make their own decisions based on their specific investment objectives and financial circumstances.
This site may contain links to external websites that are not provided or maintained by or in any way affiliated with Ryan Mallory and/or SharePlanner. Please note that Ryan Mallory and/or SharePlanner do not guarantee the accuracy, relevance, timeliness, or completeness of any information on these external websites.
By using this website, you agree that Ryan Mallory and/or SharePlanner and any affiliated parties are not responsible for any losses or damages resulting from your use of or reliance on the information provided.
It is strongly recommended that you consult with a qualified professional before making any financial decisions.