
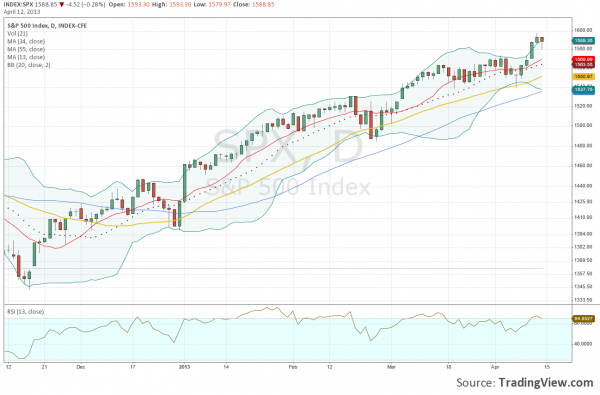
Remember how April started with a correction scare after the S&P reached new highs? There were rumors of 5% corrections down to 1450 sprinkled in with the 5-15 minute reminders on the financial news channel that we are, or were just a moment ago, at record highs. Then, the pullback continued into a blowoff bottom to the 34-MA, only to shoot back up at algorithm speeds. Now we’re back to the record highs with two days of a major whipsaw to skim some cash off the stoppers before the next move.
And through all this, I have not been hammered by rantings about the Fed and POMO every day when visiting the dingy bear caves that I frequent online. I think bears became overcome with the real possibility of ending a 6-month, 45-degree angle rise in an index that supposedly is calculated solely by the aggregate of 500 individual companies (heretofore known as “madness”).
In March I found myself daily checking the published POMO schedule to see how much money was getting printed that day. Because I found there was a high percentage of correlation in market performance that day based on the dollar amount in the right column. But April seemed to disconnect all that, and suddenly POMO didn’t matter.. the Fed didn’t matter! I was getting all proud of myself because all this started the day after I posted a warning this would happen.
But, when several of my (now previously reliable) technical indicators were calling for a correction on Dec. 28, Feb. 25, March 21, and April 5, the S&P instead opened the following day with a gap up and outsized green candle. It wasn’t like it bounced off a wall, instead it was hit by a racquet (or flipper or bat, choose your analogy) and flew back up to run along the upper range of an uptrend. In other words, it feels unnatural. But perhaps you already knew that? Everyone keeps talking about how this has been the most hated rally they’ve ever seen.
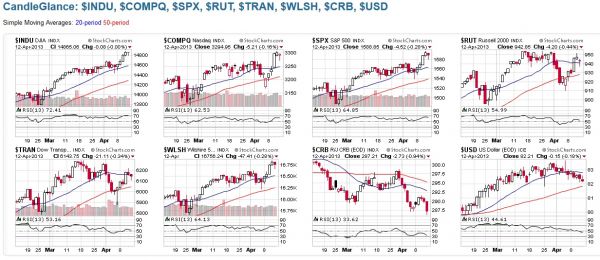
And now, finally, to my point: I would normally be looking for a down-day on Monday, especially with a potential Bollinger Band reversal setting up. Plus, Dow Theory says this madness needs to end soon. Russell Theory (I just came up with that) also says this madness needs to end soon. There are other correlations that are showing divergences, and have been for MONTHS, such as bond and commodity prices. That suggests this madness needs to end soon.
But April 15 this year is going to be a triple witching day in my book, because 1) it’s a Monday, 2) it’s Tax Day, and 3) POMO is going to be a relatively high $4.75-$5.75 Billion.
You know, a little sumthin’-sumthin’ to give stock prices that extra kick they need to resume upper limit ramping. Here’s the current POMO schedule as a reminder: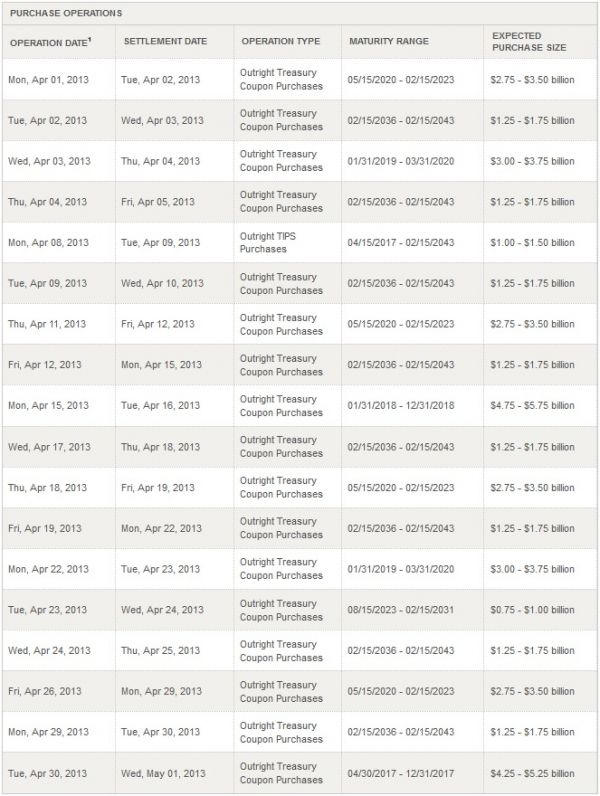
Notice that Tuesday after big tax day is a bye day? So is Thursday the 25 (isn’t that a Fed announcement day?). The plan is also to send April off with a big bang on the 30th with another triple-serving of cash, but not as big as tax day’s infusion. I think the idea is to have the gaps and longest green candles on the days where bad news would normally cause a proper correction.
I mean, look at the day after Congress kicked the Fiscal Cliff can down the road. That was a sign of weakness to me that they couldn’t meet their own years-old deadlines and just pushed the date back instead. And must I mention again that I heard my technical indicators screaming that correction was coming. The next morning markets SOARED (god, I hate that word now) as though it was giving a raucous standing ovation. Kinda like this:
Anyway, check out the charts below and ask yourself if the madness is going to end, or will all those sad-face charts instead recouple up to the Dow and S&P? When you get the answer, please tell me!


Welcome to Swing Trading the Stock Market Podcast!
I want you to become a better trader, and you know what? You absolutely can!
Commit these three rules to memory and to your trading:
#1: Manage the RISK ALWAYS!
#2: Keep the Losses Small
#3: Do #1 & #2 and the profits will take care of themselves.
That’s right, successful swing-trading is about managing the risk, and with Swing Trading the Stock Market podcast, I encourage you to email me (ryan@shareplanner.com) your questions, and there’s a good chance I’ll make a future podcast out of your stock market related question.
Watching the dollars rise and fall in your trading account can turn a well-planned swing trade into an emotional, deeply personal decision. In this episode, I explain why focusing on price action, percentage returns, and R-multiples can help you avoid cutting winners early, holding losers too long, and abandoning your trading plan.
Be sure to check out my Swing-Trading offering through SharePlanner that goes hand-in-hand with my podcast, offering all of the research, charts and technical analysis on the stock market and individual stocks, not to mention my personal watch-lists, reviews and regular updates on the most popular stocks, including the all-important big tech stocks. Check it out now at: https://www.shareplanner.com/premium-plans
📈 START SWING-TRADING WITH ME! 📈
Click here to subscribe: https://shareplanner.com/tradingblock
— — — — — — — — —
💻 STOCK MARKET TRAINING COURSES 💻
Click here for all of my training courses: https://www.shareplanner.com/trading-academy
– The A-Z of the Self-Made Trader –https://www.shareplanner.com/the-a-z-of-the-self-made-trader
– The Winning Watch-List — https://www.shareplanner.com/winning-watchlist
– Patterns to Profits — https://www.shareplanner.com/patterns-to-profits
– Get 1-on-1 Coaching — https://www.shareplanner.com/coaching
— — — — — — — — —
❤️ SUBSCRIBE TO MY YOUTUBE CHANNEL 📺
Click here to subscribe: https://www.youtube.com/shareplanner?sub_confirmation=1
🎧 LISTEN TO MY PODCAST 🎵
Click here to listen to my podcast: https://open.spotify.com/show/5Nn7MhTB9HJSyQ0C6bMKXI
— — — — — — — — —
💰 FREE RESOURCES 💰
— — — — — — — — —
🛠 TOOLS OF THE TRADE 🛠
Software I use (TC2000): https://bit.ly/2HBdnBm
— — — — — — — — —
📱 FOLLOW SHAREPLANNER ON SOCIAL MEDIA 📱
*Disclaimer: Ryan Mallory is not a financial adviser and this podcast is for entertainment purposes only. Consult your financial adviser before making any decisions.

You Might Like

South Korea: The Hidden Driver of US Tech Volatility

Stop Trying to Hit Home Runs: Start Trading Within Your Means

How to Trade Breakouts Without Getting Trapped