
Technical Outlook:
- Following a weaker than expected employment report, S&P 500 (SPX) managed to put together a small rally that lifted price back above the 5, 10 and 20-day moving averages. All three of which are just four points apart in total.

- Following the highs being established early in the trading sessions, the market proceeded to give back most of those gains until the afternoon dip buyers/rampers rallied the market into the close. Overall, the rally was meager at best.
- After the rally on Friday, this leaves the SPX in back in the undesirable area of consolidation that it spent all of August and most of July, stuck in.
- Of all the indices, the Russell 2000 (RUT), is by far, the most bullish, as it sits at the cusp of establishing new rally highs.
- SPDRs S&P 500 (SPY) volume fell off some from the day prior but was just a shade below recent averages.
- SPX on the 30 minute chart still shows a significant double top pattern that is in place and yet to be threatened to any large degree.
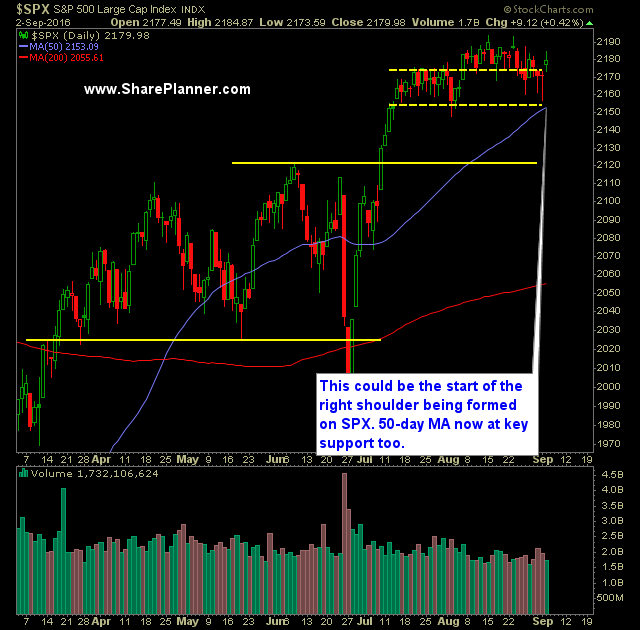
- On the daily chart, there is the possibility of a head and shoulders pattern being formed, and Friday’s action being the start of the right shoulder.
- Massive meltdown on Friday on CBOE Volatility Index (VIX) where the index saw a 11.1% drop down to 11.98. It was an unusual sell-off considering the bandwidth of the VIX of late.
- SPX is consolidating in a very tight pattern, while stocks under the surface continue to erode in value. This same behavior was seen back in August of 2015 (but in a wider range) and ultimately led to a sudden and very sharp sell-off.
- As a trader, this is not the kind of market environment that you want where price simply reverts to the mean. You want trendlines and chart patterns. A flat, non-moving market is not ideal for trading opportunities.
- Crude Oil Futures (/CL) shows a massive head and shoulders pattern forming, going all the way back to March of this year. Break the August lows and it confirms.
- The market is showing a decoupling from oil as the rise and fall of the commodity in June, July and now August has not impacted the equities market substantially.
- Three support levels to watch going forward on SPX is 2168, 2155, and 2147. The breaks are only valid if the price can close below those support levels.
- Dow Jones Industrial Average (DJIA) has a double top that confirms on a move below 18247.
My Trades:
- Sold ADBE on Friday at $103.44 for a 2.2% profit.
- Covered TSCO on Friday at $84.99 for a 1.4% loss.
- Added one new swing-trade to the portfolio on Friday.
- May add 1-2 new swing-trades to the portfolio today.
- Will consider adding additional short positions to the portfolio as the market warrants it.
- Currently 10% Long / 40% Short / 50% Cash
- Join me each day for all my real-time trades and alerts in the SharePlanner Splash Zone
Chart for SPX:


Welcome to Swing Trading the Stock Market Podcast!
I want you to become a better trader, and you know what? You absolutely can!
Commit these three rules to memory and to your trading:
#1: Manage the RISK ALWAYS!
#2: Keep the Losses Small
#3: Do #1 & #2 and the profits will take care of themselves.
That’s right, successful swing-trading is about managing the risk, and with Swing Trading the Stock Market podcast, I encourage you to email me (ryan@shareplanner.com) your questions, and there’s a good chance I’ll make a future podcast out of your stock market related question.
Watching the dollars rise and fall in your trading account can turn a well-planned swing trade into an emotional, deeply personal decision. In this episode, I explain why focusing on price action, percentage returns, and R-multiples can help you avoid cutting winners early, holding losers too long, and abandoning your trading plan.
Be sure to check out my Swing-Trading offering through SharePlanner that goes hand-in-hand with my podcast, offering all of the research, charts and technical analysis on the stock market and individual stocks, not to mention my personal watch-lists, reviews and regular updates on the most popular stocks, including the all-important big tech stocks. Check it out now at: https://www.shareplanner.com/premium-plans
📈 START SWING-TRADING WITH ME! 📈
Click here to subscribe: https://shareplanner.com/tradingblock
— — — — — — — — —
💻 STOCK MARKET TRAINING COURSES 💻
Click here for all of my training courses: https://www.shareplanner.com/trading-academy
– The A-Z of the Self-Made Trader –https://www.shareplanner.com/the-a-z-of-the-self-made-trader
– The Winning Watch-List — https://www.shareplanner.com/winning-watchlist
– Patterns to Profits — https://www.shareplanner.com/patterns-to-profits
– Get 1-on-1 Coaching — https://www.shareplanner.com/coaching
— — — — — — — — —
❤️ SUBSCRIBE TO MY YOUTUBE CHANNEL 📺
Click here to subscribe: https://www.youtube.com/shareplanner?sub_confirmation=1
🎧 LISTEN TO MY PODCAST 🎵
Click here to listen to my podcast: https://open.spotify.com/show/5Nn7MhTB9HJSyQ0C6bMKXI
— — — — — — — — —
💰 FREE RESOURCES 💰
— — — — — — — — —
🛠 TOOLS OF THE TRADE 🛠
Software I use (TC2000): https://bit.ly/2HBdnBm
— — — — — — — — —
📱 FOLLOW SHAREPLANNER ON SOCIAL MEDIA 📱
*Disclaimer: Ryan Mallory is not a financial adviser and this podcast is for entertainment purposes only. Consult your financial adviser before making any decisions.

You Might Like

South Korea: The Hidden Driver of US Tech Volatility

Stop Trying to Hit Home Runs: Start Trading Within Your Means

How to Trade Breakouts Without Getting Trapped