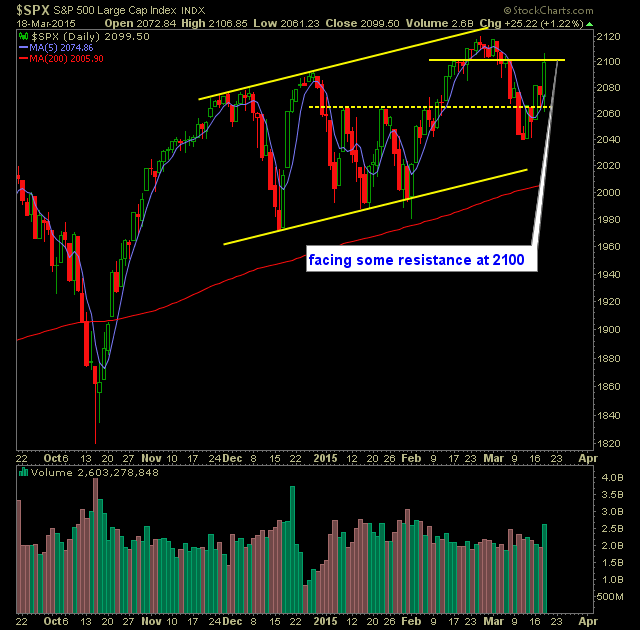
Technical Outlook (SPX): SPX held 2065 yesterday despite an intraday dip below, and managed to rally in a significant manner following the FOMC Statement yesterday. Despite “Patient” being dropped from the statement, the Fed went out of its way to still frame the statement as overly dovish. SPX regained the 20-day moving average yesterday. One
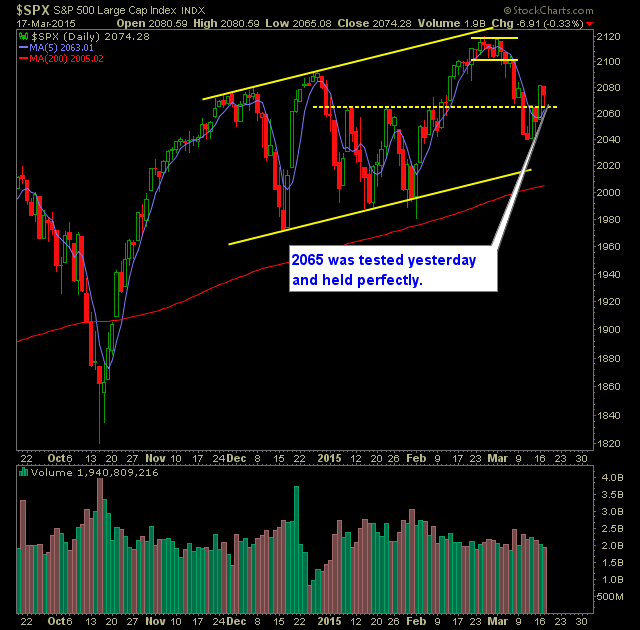
Technical Outlook (SPX): SPX tested 2065 yesterday and held on to its support perfectly before bouncing and eliminating over half the day’s losses. Choppy and difficult market for trading. Nonetheless, after the strength of the two previous market rallies, the direction still appears to be pointing upward. Any action out of the market today

Technical Outlook (SPX): Key break yesterday as SPX pushed through 2065. A pivotal price resistance level. Despite the large rally, the VIX was largely unimpressed, only moving 2.4% down to 15.6%. SPX looks to show some profit taking at the open this morning. The key is whether it can hold on to 2065

Technical Outlook (SPX): SPX once again was not able to break through the 2065 resistance level. After selling off hard on Friday, SPX saw 1/2 of its gains quickly evaporate into the final hour of trading. VIX popped 3.7% on Friday to 16.00. Considering the fact that SPX has been down three straight

Technical Outlook (SPX): Heavy bounce yesterday that sent price right back inside of the Bollinger Band. SPX finished right at an old resistance level at 2065. It’ll be interesting to see whether this price level becomes a problem again for SPX to break through. Yesterday’s bounce took price back above the 5-day moving average

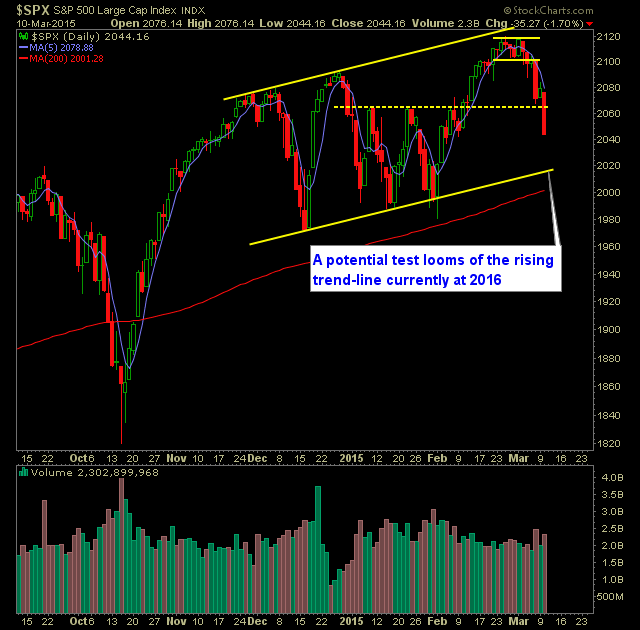
Technical Outlook (SPX): Massive breakdown in the markets yesterday that saw SPX decline by over 1.7%. Key support at 2065 was violated yesterday. As it stands now, SPX is now in negative territory for the year. SPX sliced right through the 50-day moving average after trying to bounce off of it early on in

Technical Outlook (SPX): SPX managed to bounce off of support the past two days at 2065. This morning that support looks to be violated with a nasty gap down to open the session. Yesterday’s mini-bounce shows nothing more, at this point, then a bear flag on the 30-minute chart that will be confirmed


Technical Outlook (SPX): Very small rally that saw the bulls unable to push price back into the price range between 2103 and 2117. Massive, and I do mean massive, head and shoulders pattern forming on the 30 minute SPX chart dating back to mid-February. Some support seems to be found on the daily chart

spc@shareplanner.com
(904) 800-8420
© Copyright 2025 | SharePlanner Inc. All Rights Reserved.
Disclaimer: The information provided on this website is for educational and informational purposes only. Ryan Mallory and/or SharePlanner are not licensed financial advisors, brokers, or tax professionals. The content on this site should not be considered as financial, investment, tax, or legal advice.
All information and opinions expressed herein are based on sources believed to be accurate and reliable. However, we make no representation or warranty as to their accuracy, completeness, or reliability. Any action you take upon the information on this website is strictly at your own risk.
Past performance is not indicative of future results. Investing involves risk, including the possible loss of principal. All investors should make their own decisions based on their specific investment objectives and financial circumstances.
This site may contain links to external websites that are not provided or maintained by or in any way affiliated with Ryan Mallory and/or SharePlanner. Please note that Ryan Mallory and/or SharePlanner do not guarantee the accuracy, relevance, timeliness, or completeness of any information on these external websites.
By using this website, you agree that Ryan Mallory and/or SharePlanner and any affiliated parties are not responsible for any losses or damages resulting from your use of or reliance on the information provided.
It is strongly recommended that you consult with a qualified professional before making any financial decisions.