

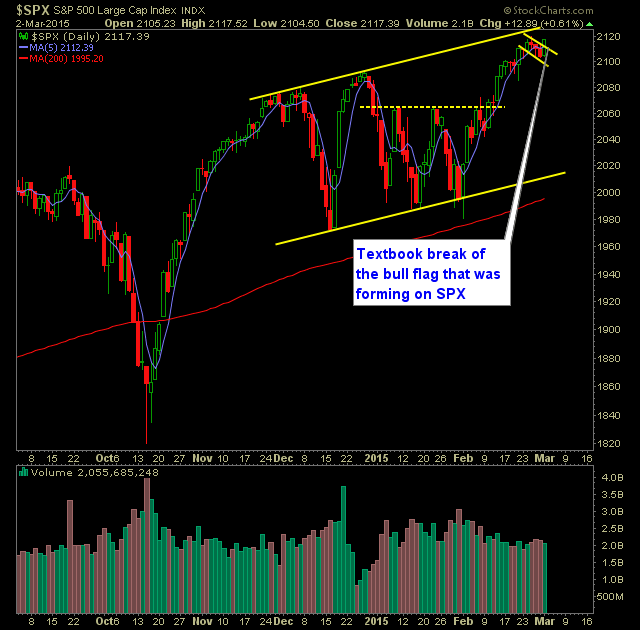
Technical Outlook (SPX): SPX had an inside trading day after a squandering a perfect bull flag breakout the day prior. Watch for a short-term break in support at 2102 on the 30 minute chart. SPX 30 minute chart shows the potential for a double top to confirm today. Volume picked up yesterday despite

Technical Outlook (SPX): On Friday, SPX saw its biggest sell-off since Friday, 2/6/15, while closing below its 10-day moving average for the first time since 2/3/15. For now, the uptrend of SPX is not jeopardizing, but the bulls need to pull it together here real soon, or the bears may become inspired yet again.
-
Technical Outlook (SPX): Another near-problematic trading session for the bulls that saw the bulls close below the 5-day moving average for the first time since 2/9/15. The 10-day moving average was tested and held strong – to perfection actually. For now, the uptrend of SPX is not jeopardizing, but the bulls need to pull

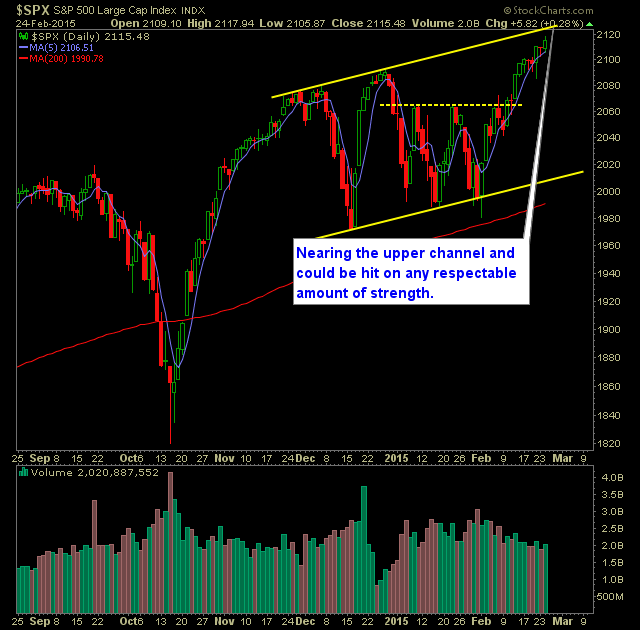
Technical Outlook (SPX): SPX drifted higher yesterday, and saw early morning weakness get quickly bought up. Following Friday’s breakout, we have a nice series of higher highs and higher lows on the 30 minute chart of SPX. Nasdaq has pushed higher for 10 straight days – a rarity by any measure, with the negative

Technical Outlook (SPX): Sixth straight day where SPX spent the majority of the day digging itself out of the hole, yet managing to finish near break even or higher. Futures are pointing slightly higher for /ES which is a rarity these days. Volume was off yesterday and well off of the previous day’s volume
-

Technical Outlook (SPX): SPX cooled off yesterday, albeit barely, finishing slightly lower for only the second time in six trading sessions. 5-day moving average continues to represent a short-term rising support level, that SPX has held Volume continues to be particularly weak across the board, especially with SPY. However, we’ve seen this numerous times

spc@shareplanner.com
(904) 800-8420
© Copyright 2025 | SharePlanner Inc. All Rights Reserved.
Disclaimer: The information provided on this website is for educational and informational purposes only. Ryan Mallory and/or SharePlanner are not licensed financial advisors, brokers, or tax professionals. The content on this site should not be considered as financial, investment, tax, or legal advice.
All information and opinions expressed herein are based on sources believed to be accurate and reliable. However, we make no representation or warranty as to their accuracy, completeness, or reliability. Any action you take upon the information on this website is strictly at your own risk.
Past performance is not indicative of future results. Investing involves risk, including the possible loss of principal. All investors should make their own decisions based on their specific investment objectives and financial circumstances.
This site may contain links to external websites that are not provided or maintained by or in any way affiliated with Ryan Mallory and/or SharePlanner. Please note that Ryan Mallory and/or SharePlanner do not guarantee the accuracy, relevance, timeliness, or completeness of any information on these external websites.
By using this website, you agree that Ryan Mallory and/or SharePlanner and any affiliated parties are not responsible for any losses or damages resulting from your use of or reliance on the information provided.
It is strongly recommended that you consult with a qualified professional before making any financial decisions.