
$AKAM gapped above the inverse head and shoulders neckline, but I think it's better to wait for a pullback to the neckline before considering a new long position at this point. $UNG held the breakout level into the close. Worth watching going forward. Serious puking underway on $SPY ahead of tomorrow's CPI Report. $UNH in

If $AMD breaks short-term support, I would be looking for the next leg lower to start on the stock. $SPY is trading in the gap now. Nice pullback for $BYD to the lower channel band, but my big concern here is the fact that it has now made to consecutive lower-highs following a bounce. $DWAC
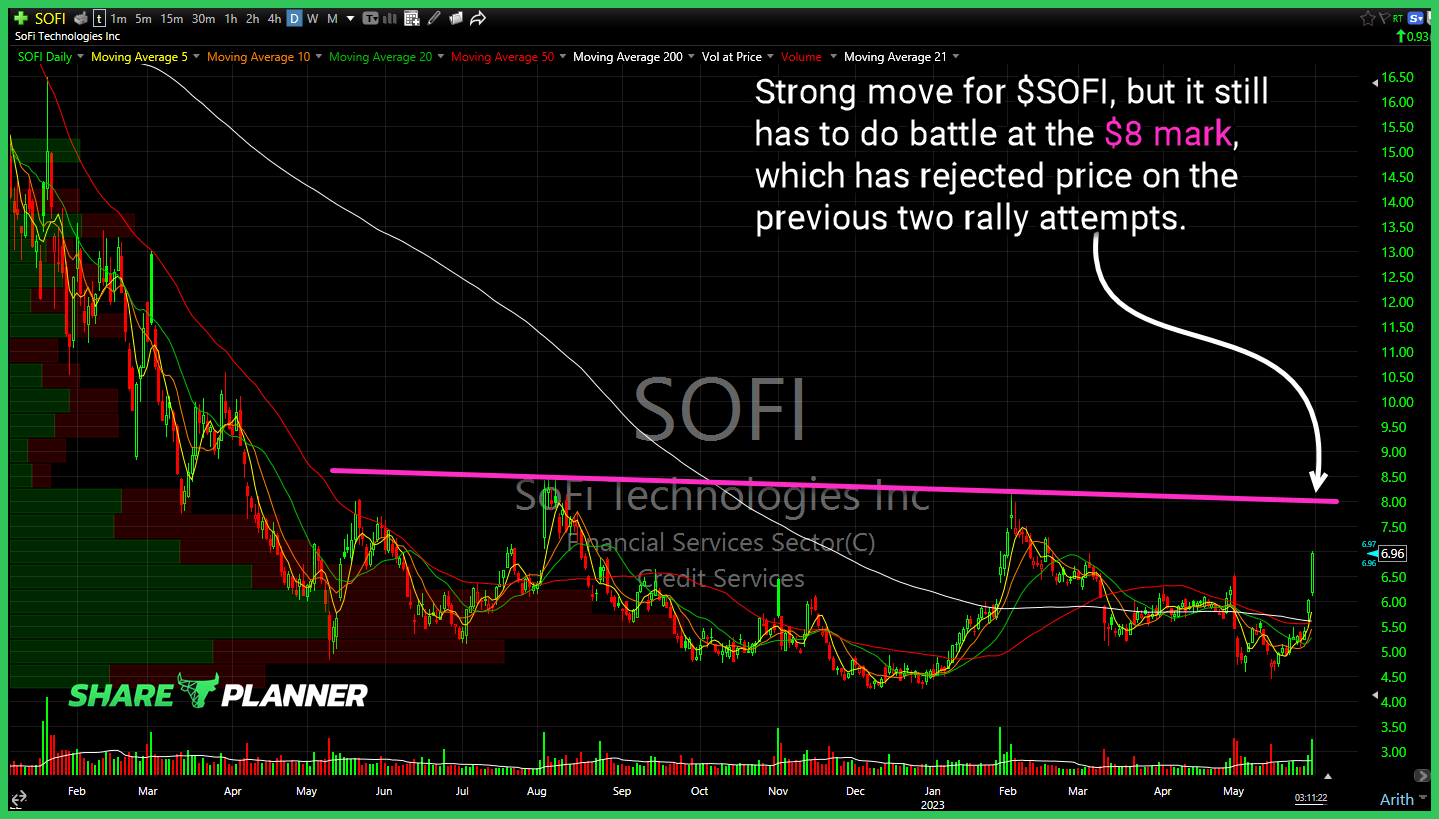
Strong move for $SOFI, but it still has to do battle at the $8 mark, which has rejected price on the previous two rally attempts. $NVDA gap closed, but the effort to bounce it after that failed. Watch for an attempt at filling the second gap. $UNH price action still a struggle, but if it
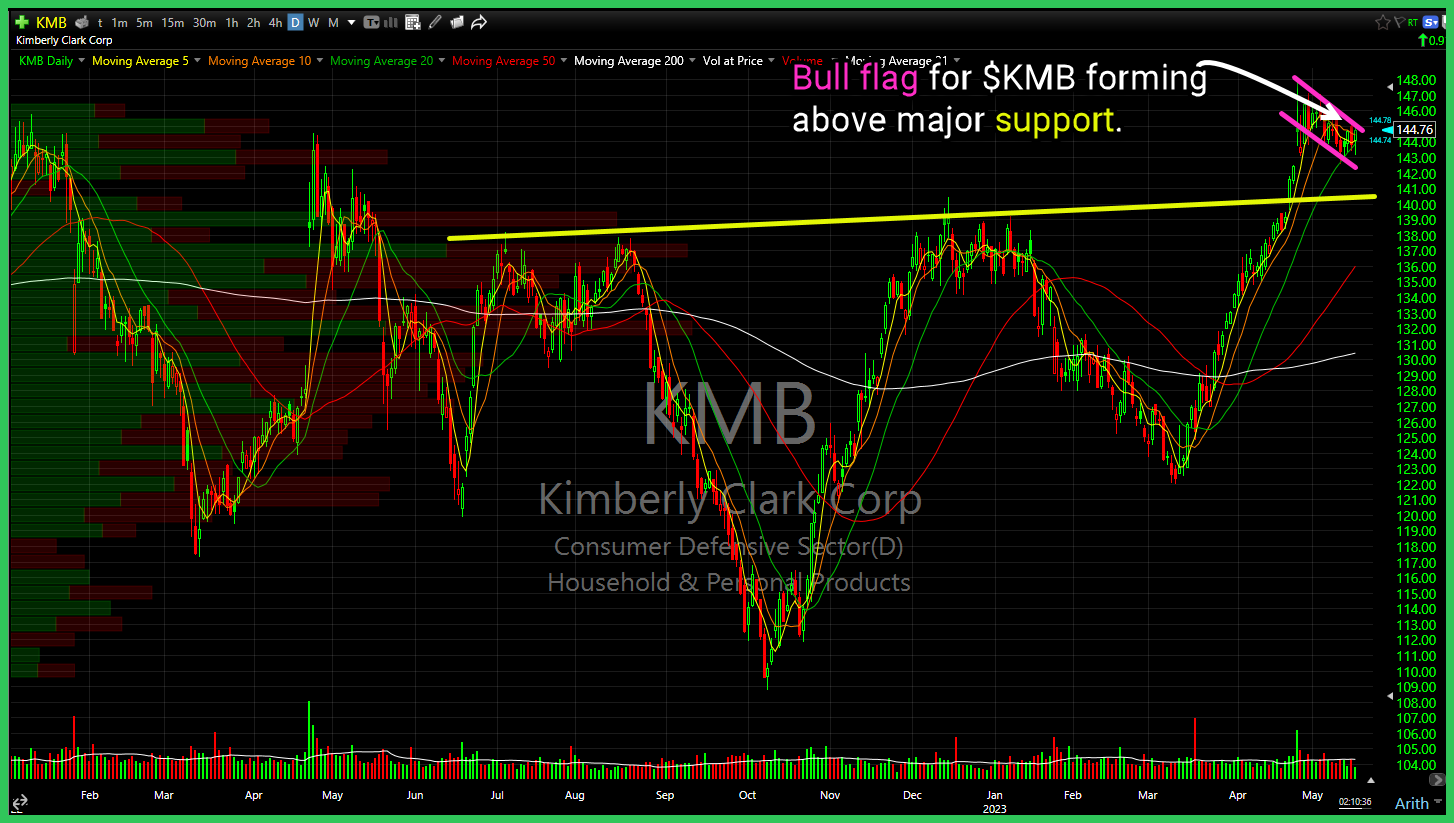
Bull flag for $KMB forming above major support.
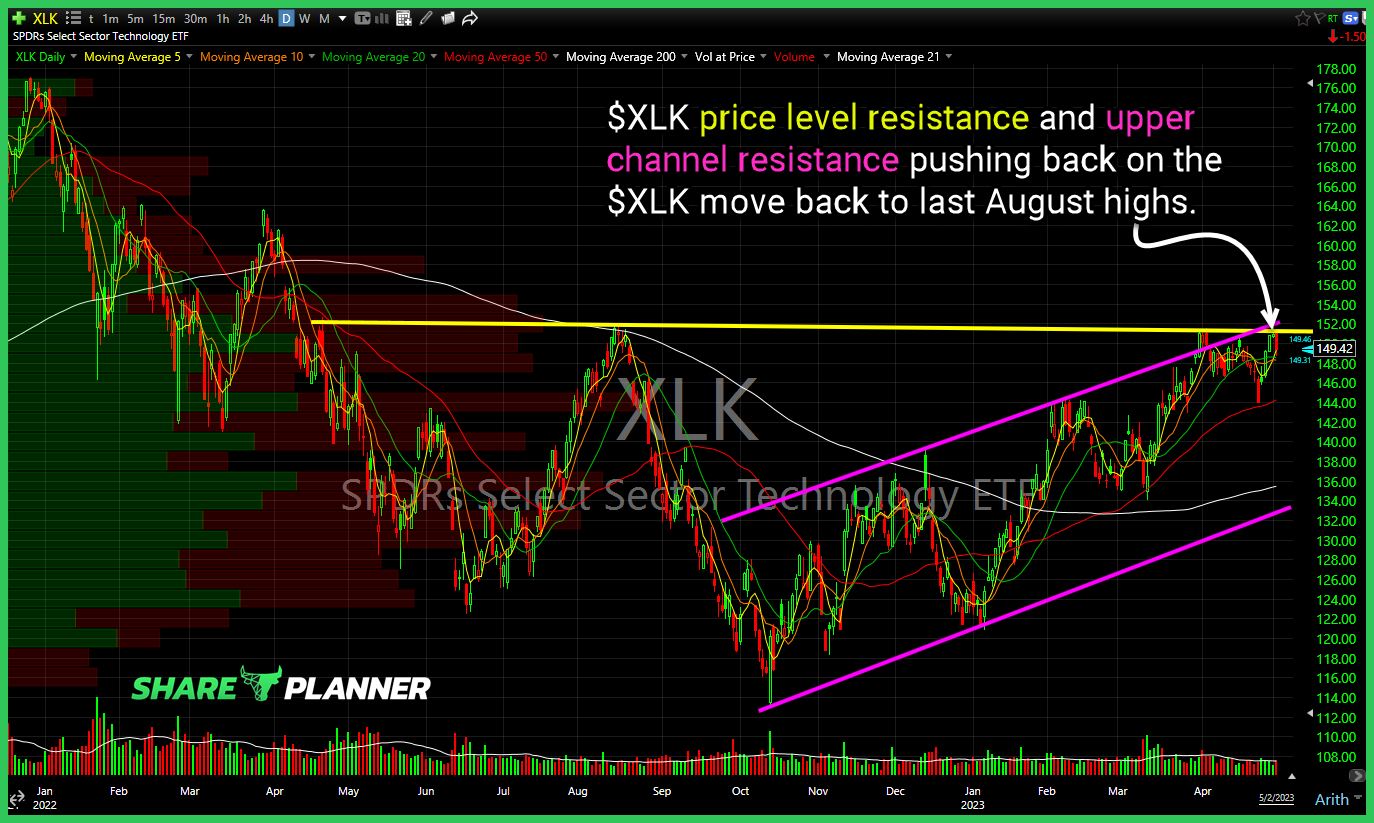
$XLK price level resistance and upper channel resistance pushing back on the $XLK move back to last August highs.
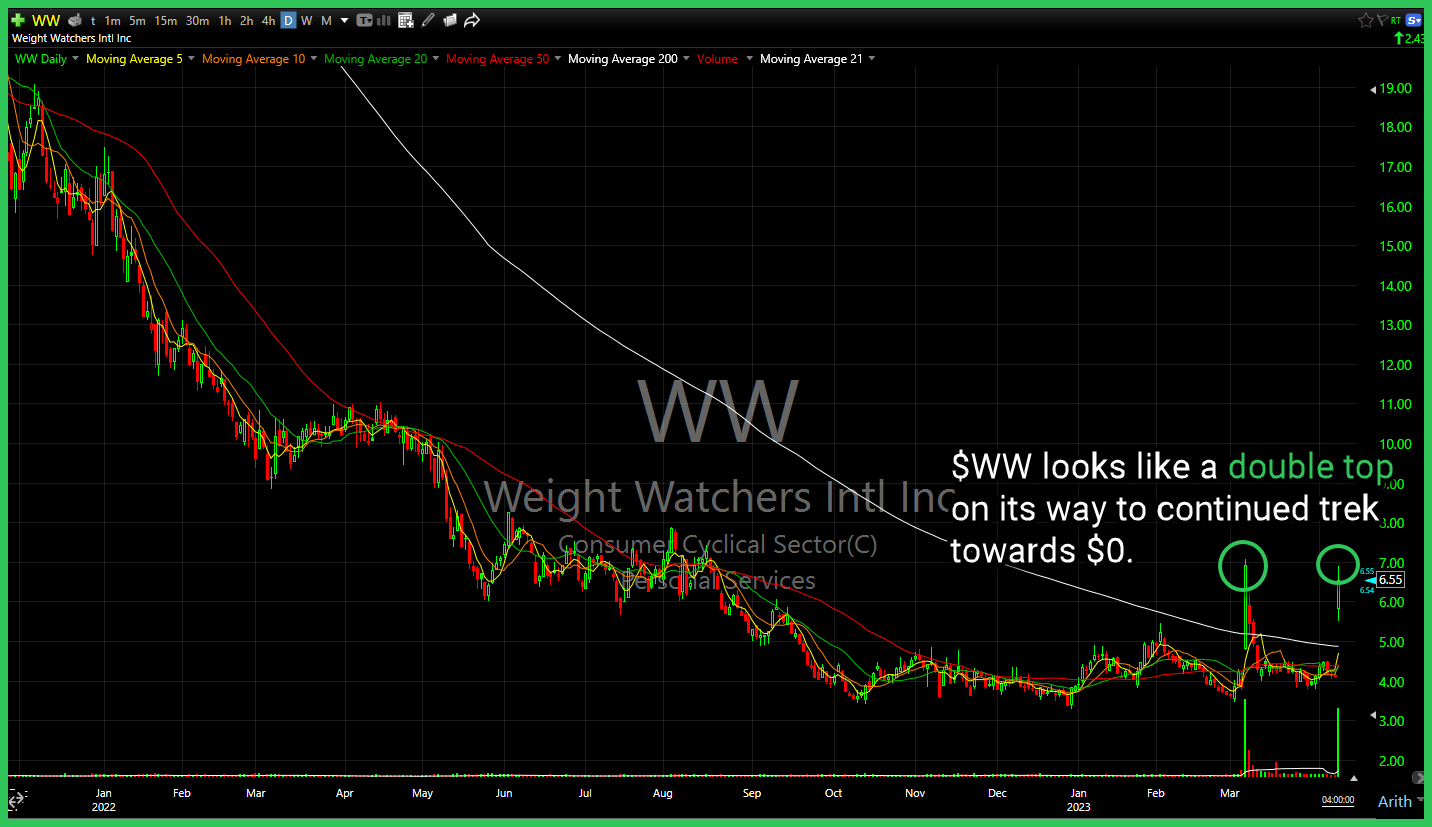
$WW looks like a double top on its way to continued trek towards $0. lol

Q&A session going over the stock market price action over the past week, and the impact that 0DTE traders are having on the overall market.
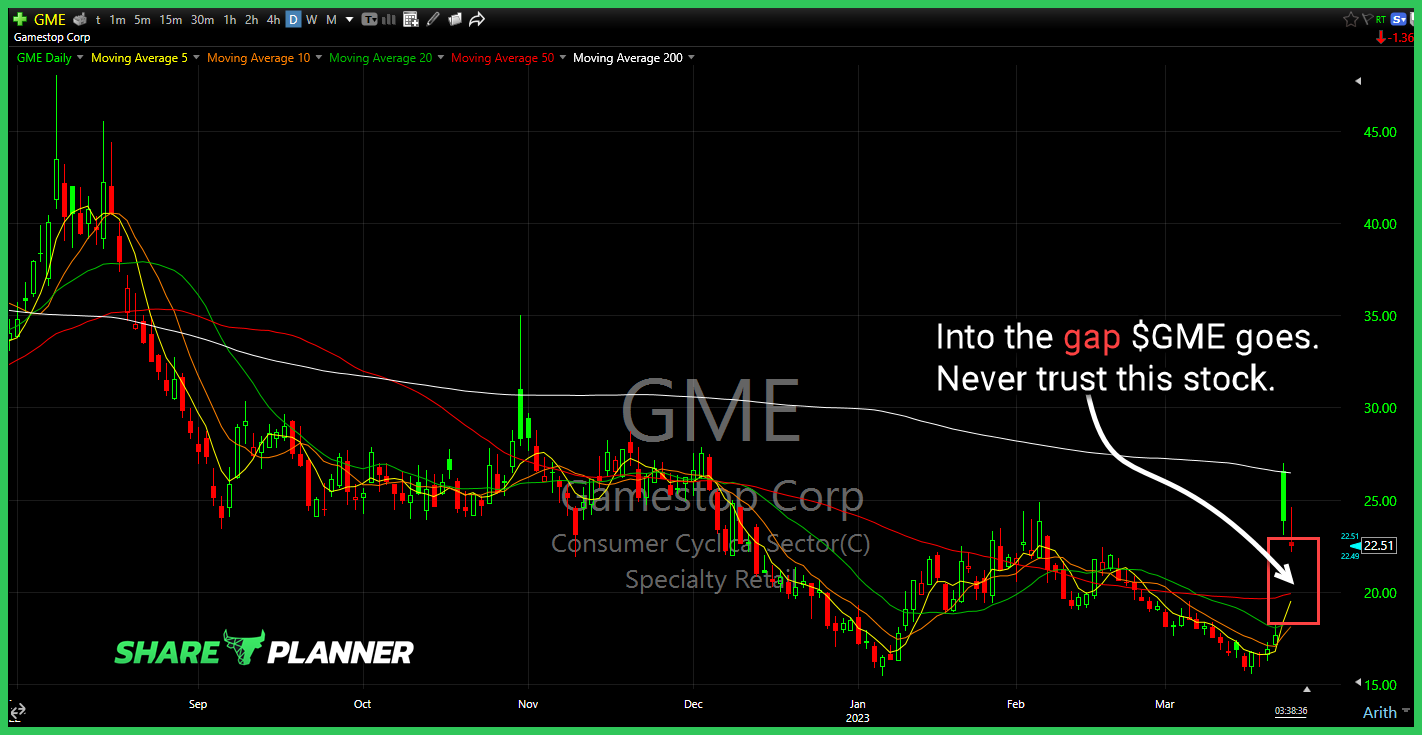
Into the gap GameStop (GME) goes. Never trust this stock. S&P 500 (SPY) gave up all the day's gains and broke yesterday's lows. Bad omen for this market. Netflix (NFLX) price resistance here worth keeping a close eye on. Pimco Total Return ETF (BOND) nearing resistance from July '22 for a potential breakout.
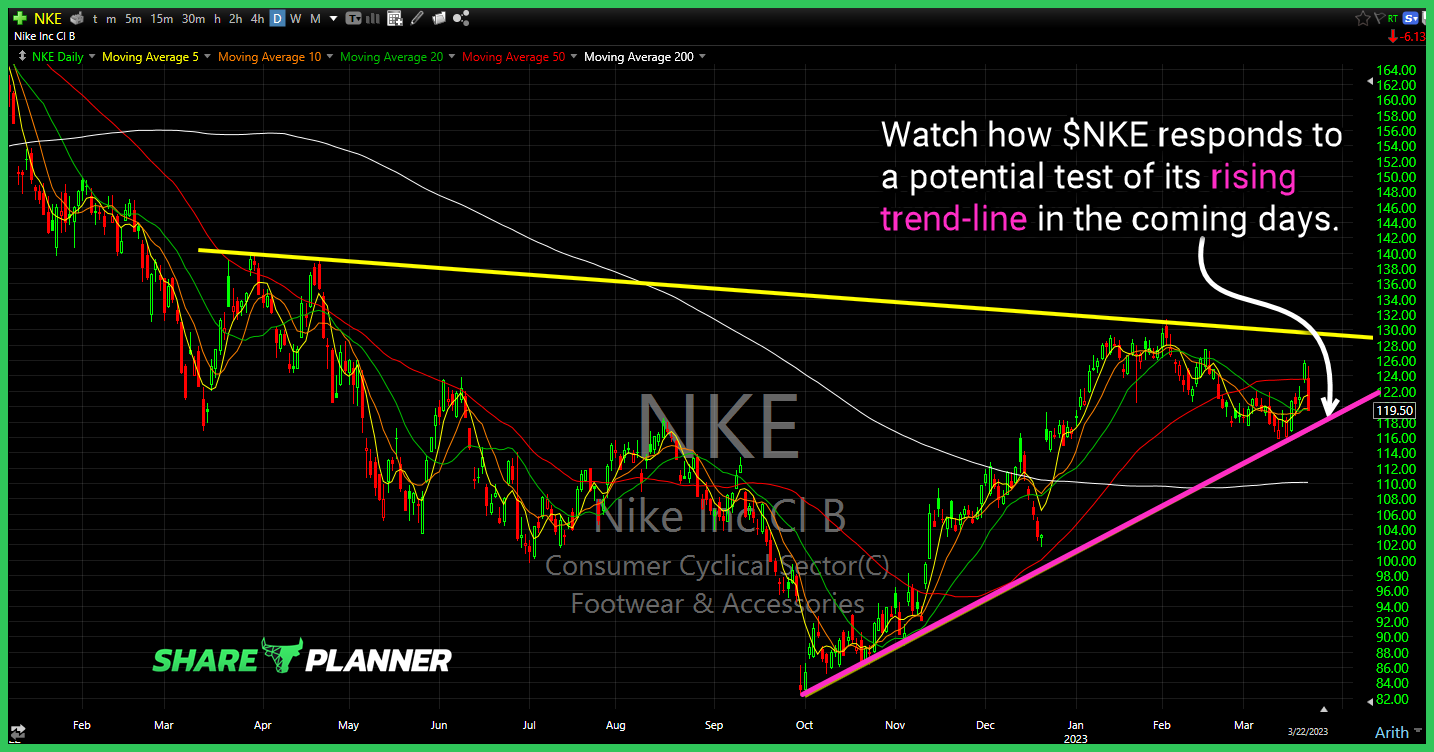
Watch how Nike (NKE) responds to a potential test of its rising trend-line in the coming days. SPX with a 103 point sell-off, those chasing the initial bullish reaction got fleeced today! Somewhat muted SPY response so far following FOMC Statement. Semiconductors ETF (SMH) testing resistance going back to May of last year.
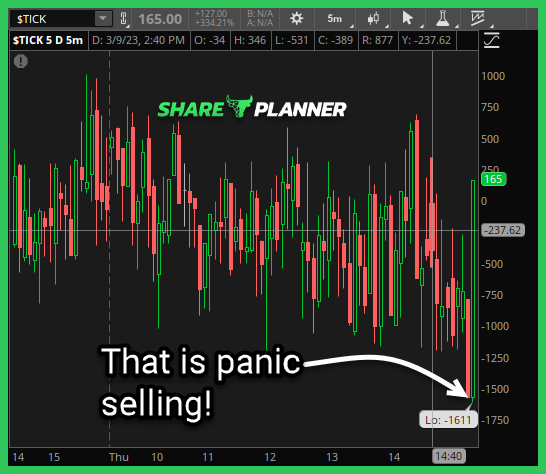
Panic selling on the $TICK

spc@shareplanner.com
(904) 800-8420
© Copyright 2025 | SharePlanner Inc. All Rights Reserved.
Disclaimer: The information provided on this website is for educational and informational purposes only. Ryan Mallory and/or SharePlanner are not licensed financial advisors, brokers, or tax professionals. The content on this site should not be considered as financial, investment, tax, or legal advice.
All information and opinions expressed herein are based on sources believed to be accurate and reliable. However, we make no representation or warranty as to their accuracy, completeness, or reliability. Any action you take upon the information on this website is strictly at your own risk.
Past performance is not indicative of future results. Investing involves risk, including the possible loss of principal. All investors should make their own decisions based on their specific investment objectives and financial circumstances.
This site may contain links to external websites that are not provided or maintained by or in any way affiliated with Ryan Mallory and/or SharePlanner. Please note that Ryan Mallory and/or SharePlanner do not guarantee the accuracy, relevance, timeliness, or completeness of any information on these external websites.
By using this website, you agree that Ryan Mallory and/or SharePlanner and any affiliated parties are not responsible for any losses or damages resulting from your use of or reliance on the information provided.
It is strongly recommended that you consult with a qualified professional before making any financial decisions.