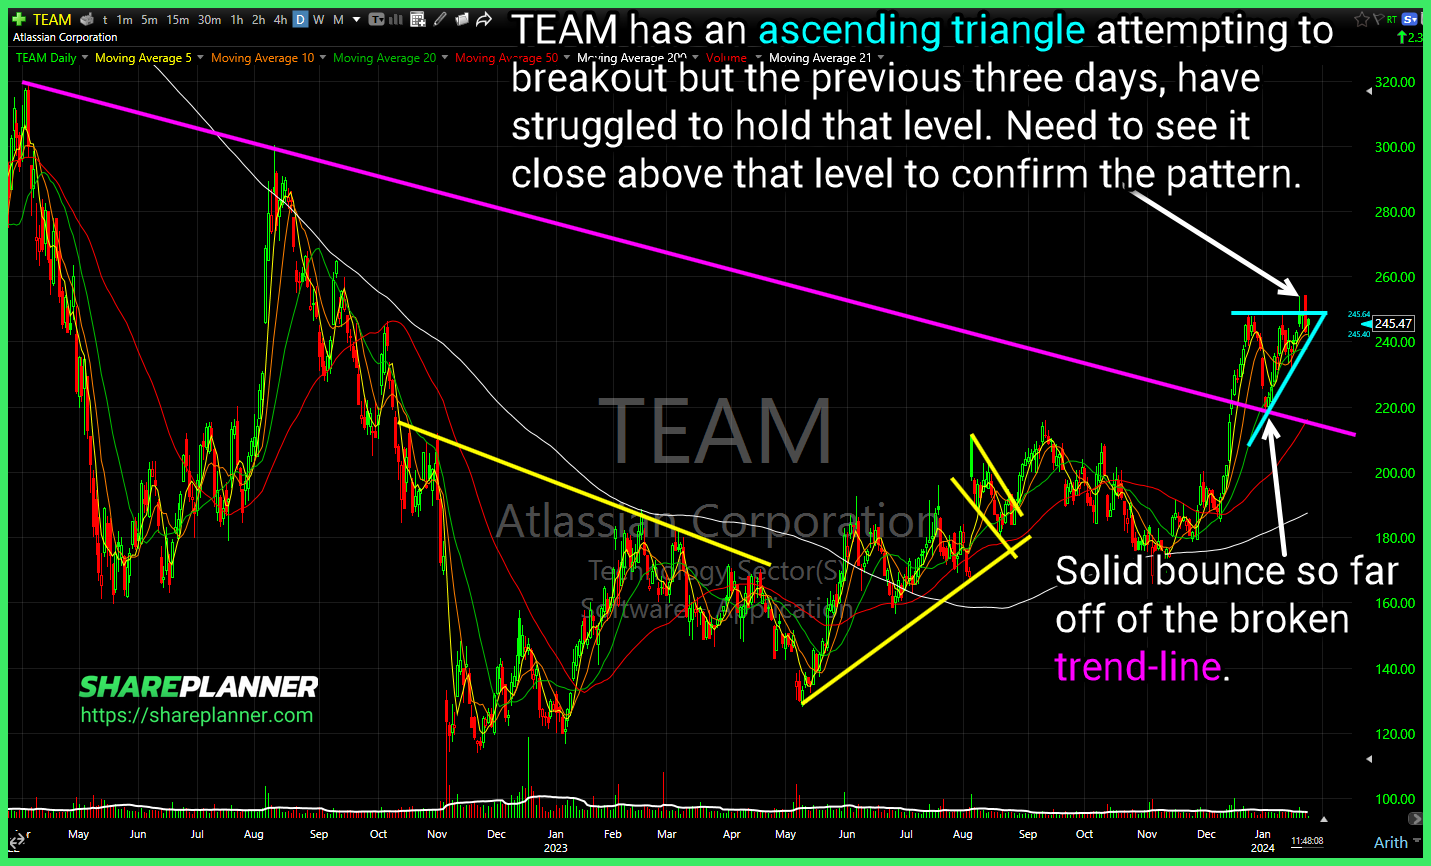
Atlassian (TEAM) has an ascending triangle attempting to breakout but the previous three days, have struggled to hold that level. Need to see it close above that level to confirm the pattern. Tesla (TSLA) breaking a major support level and the October '23 lows. Here's the sector returns so far with S&P 500
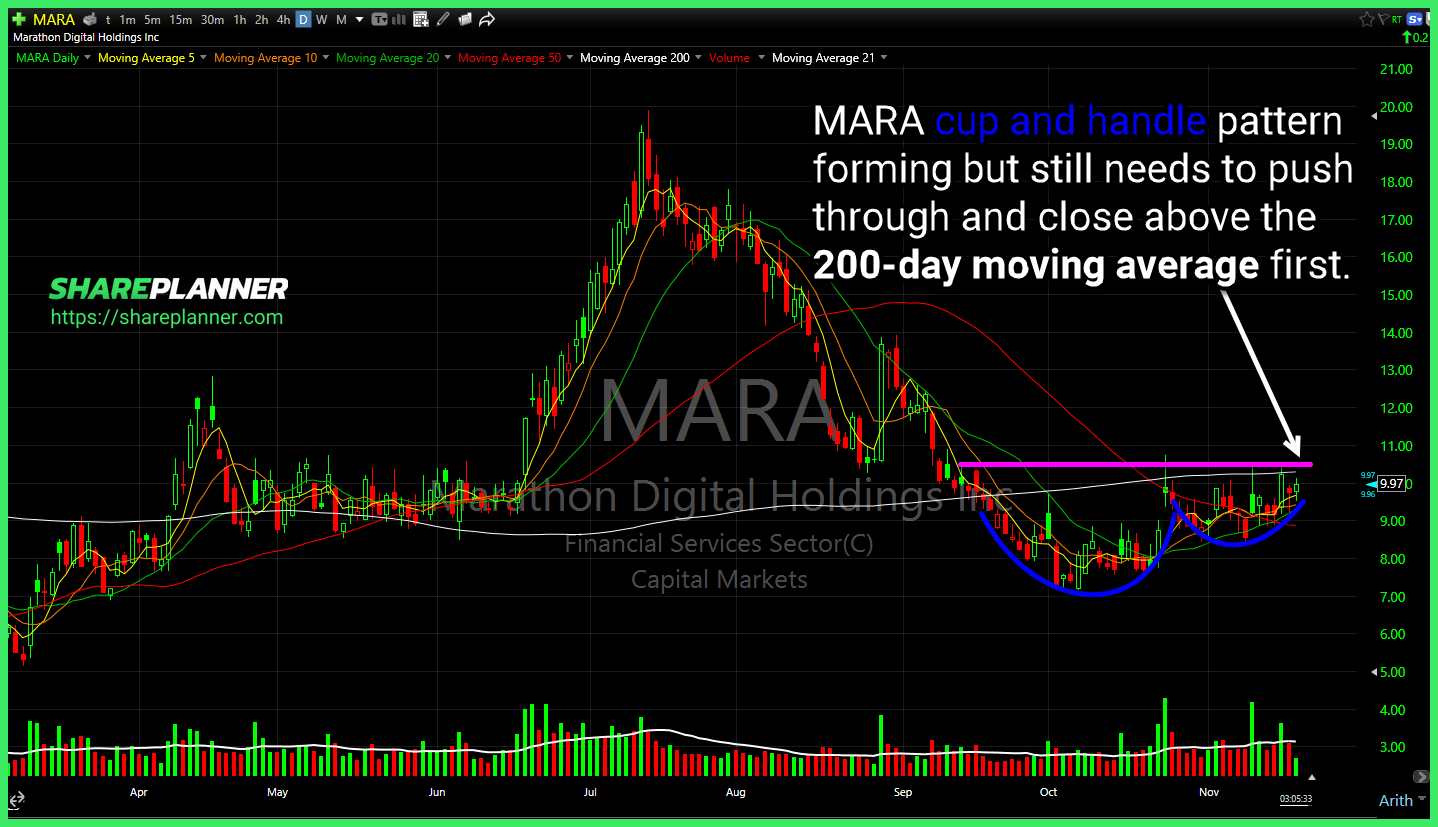
$MARA cup and handle pattern forming but still needs to push through and close above the 200-day moving average first. $PLTR attempting to break through a long-term resistance level as well as confirm a multi-year cup and handle pattern. Next stop would be upper-$20's. Since Tuesday, $QQQ has been all consolidation - going sideways since
Rising yields in the bond market are becoming a major problem For the financial and if they continue to rally higher, it will ultimately crash the stock market. In this video, I cover the impact of the rising yields and what it means for stocks and the stock market going forward.

The S&P 500 and Nasdaq 100 has been on a 3 day rally and the Russell 2000 has been on a 5 day rally! But can it last? How much more room to rally does the stock market have to rally. Or are we simply looking at a bear market rally coming to an end

Stock have been in a steep sell-off of late and poised for a bounce here in the near term. Can we expect a dead cat bounce here? Or will the stock market crash continue for the foreseeable future. In this video, I provide my technical analysis for SPY, QQQ, IWM ETFs, as well as my

Multiple support levels to watch following the hard fade in AdvisorShares Pure US Cannabis ETF (MSOS). Notable support at $6.75, followed by $6.20. Johnson & Johnson (JNJ) testing the rising trend-line and attempting to bounce intraday. If broken, and moves below $157, I want nothing to do with it. Bear flag in AMC Entertainment (AMC)
Stocks have rallied hard over the last five trading sessions, but can the rally continue going into Friday's Job's number?

$F continues to hold the rising trend-line off of the March lows. Potential bounce candidate here. $NIO desperately attempting to hold major support. Close will be very important, and a hold should drastically increase the chances of a bounce from here. $QQQ declining resistance getting tested on QQQ here.

Alphabet (GOOGL) pullback to the bull flag breakout today. Will need to hold this or risk this being a failed breakout. Advanced Micro Devices (AMD) pulling back to its rising trend-line off the January lows, after failing to break out of the bull flag this morning. With today's fade off the highs of
The tech rally in the Nasdaq 100 has been spectacular, but can it continue the momentum of the past few weeks and keep rally going? In this video, I am providing my Nasdaq 100 analysis using the QQQ ETF chart, as well as going over the big tech stocks and how they might be signifying

spc@shareplanner.com
(904) 800-8420
© Copyright 2025 | SharePlanner Inc. All Rights Reserved.
Disclaimer: The information provided on this website is for educational and informational purposes only. Ryan Mallory and/or SharePlanner are not licensed financial advisors, brokers, or tax professionals. The content on this site should not be considered as financial, investment, tax, or legal advice.
All information and opinions expressed herein are based on sources believed to be accurate and reliable. However, we make no representation or warranty as to their accuracy, completeness, or reliability. Any action you take upon the information on this website is strictly at your own risk.
Past performance is not indicative of future results. Investing involves risk, including the possible loss of principal. All investors should make their own decisions based on their specific investment objectives and financial circumstances.
This site may contain links to external websites that are not provided or maintained by or in any way affiliated with Ryan Mallory and/or SharePlanner. Please note that Ryan Mallory and/or SharePlanner do not guarantee the accuracy, relevance, timeliness, or completeness of any information on these external websites.
By using this website, you agree that Ryan Mallory and/or SharePlanner and any affiliated parties are not responsible for any losses or damages resulting from your use of or reliance on the information provided.
It is strongly recommended that you consult with a qualified professional before making any financial decisions.