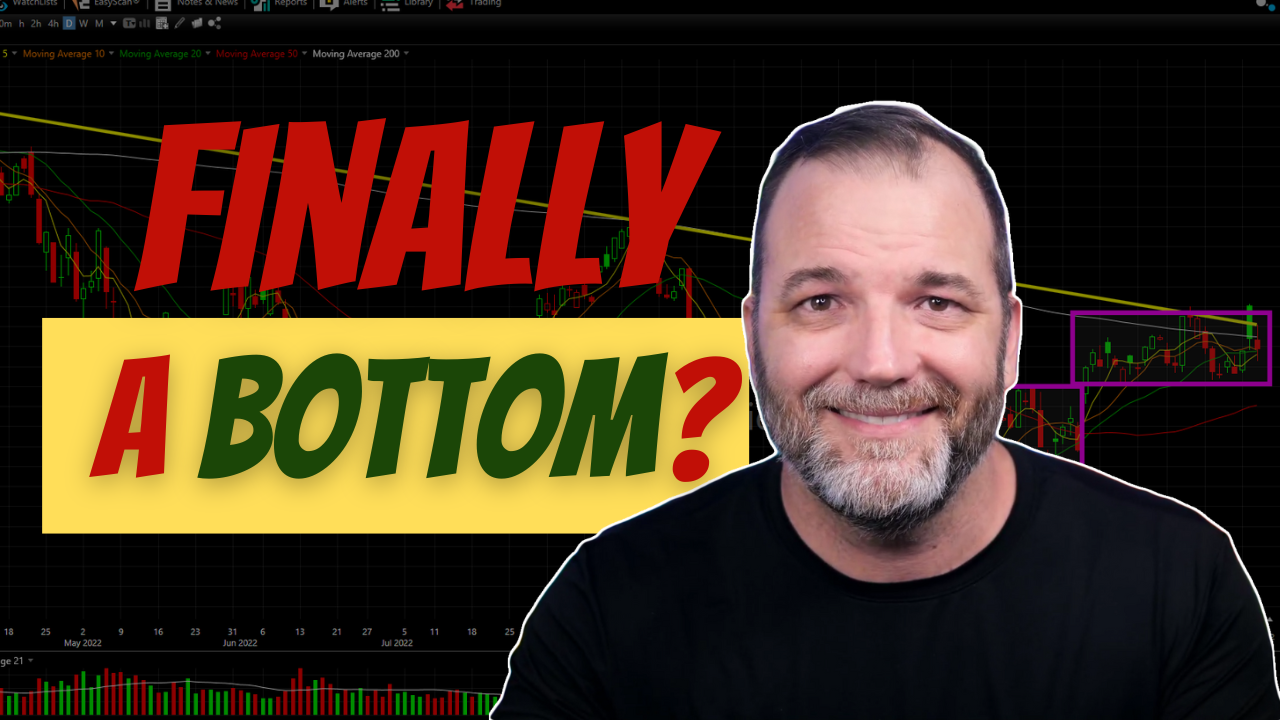
The FOMC Statement was released and Jay Powell had his presser thereafter. Stocks sold off as a result, and leaves traders wondering if we have really reached a stock market bottom. I provide my technical analysis for the stock market following the FOMC Statement and where the market looks to go from here.
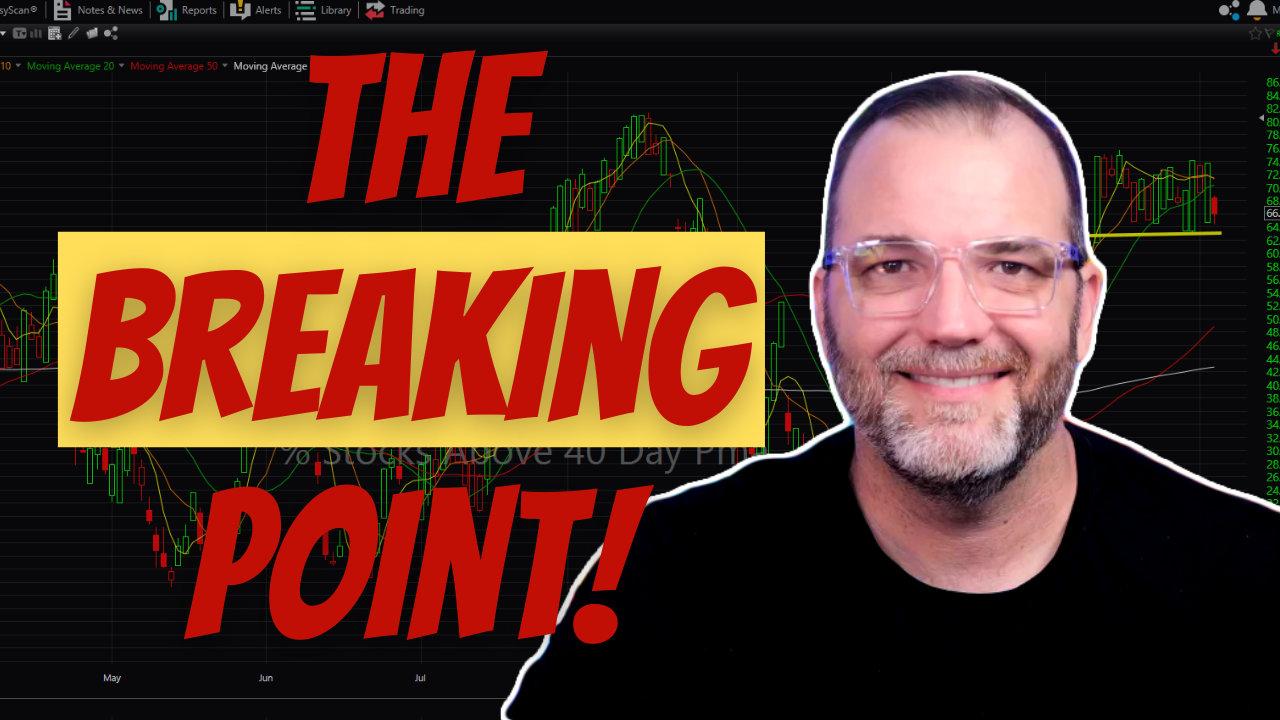
Stocks have been overextended for over a months. Following Jay Powell's speech at the Brookings Institute, it looked as if the stock market would continue to rally but it ran into heavy technical resistance and stocks since has been trending lower. Is this the time to get short or long? In this video, I provide
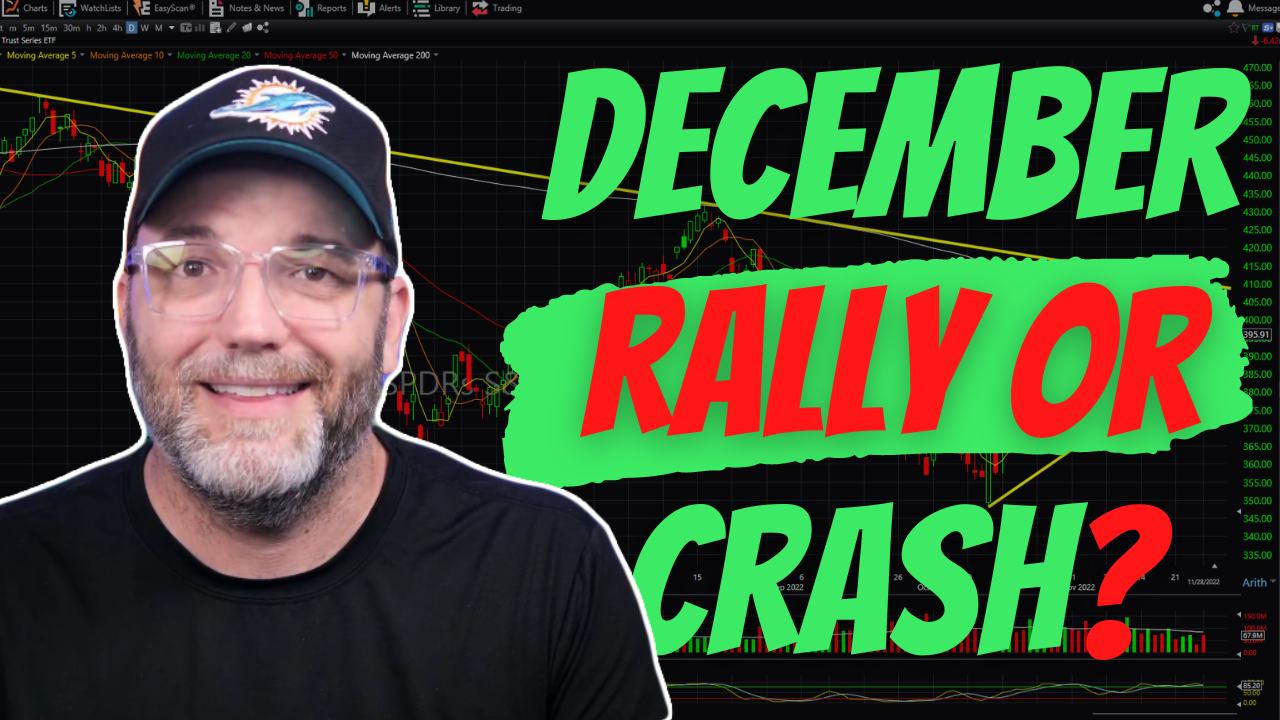
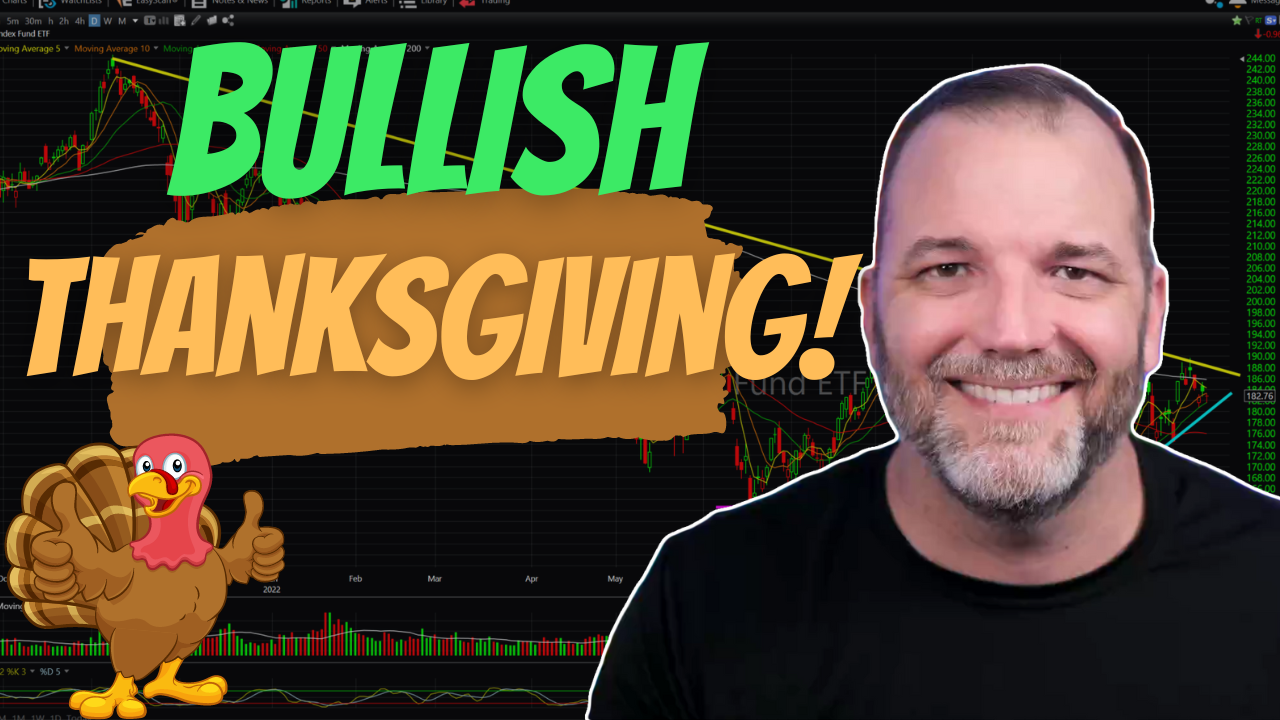
Is the stock market setting up for another epic stock market rally and bounce off the recent lows, or are we just going to continue chopping around?
The stock market crash of 2022 continues and the indices are at new year-to-day lows. Is now the time for a stock market bounce and a potential bottom to the chaos that has been seen all year long, or are we do for additional selling going into the CPI report and FOMC Minutes?
The Stock Market Crash of 2022 continues with a test this past week of the June lows following the very hawkish FOMC Statement. Can we expect a stock market rally here that will allow the market to form a double bottom, as well as an end to this stock market correction? In this video, I
The bear market of 2022 has made swing trading challenging with massive swings in price and volatility. How can you swing trade the stock market successfully in a bear market or even worse in a stock market crash? In this video, I cover three unique ways to better help you achieve profitability in a bear

The bear market of 2022 has made swing trading challenging with massive swings in price and volatility. How can you swing trade the stock market successfully in a bear market or even worse in a stock market crash? In this video, I cover three unique ways to better help you achieve profitability in a bear

spc@shareplanner.com
(904) 800-8420
© Copyright 2025 | SharePlanner Inc. All Rights Reserved.
Disclaimer: The information provided on this website is for educational and informational purposes only. Ryan Mallory and/or SharePlanner are not licensed financial advisors, brokers, or tax professionals. The content on this site should not be considered as financial, investment, tax, or legal advice.
All information and opinions expressed herein are based on sources believed to be accurate and reliable. However, we make no representation or warranty as to their accuracy, completeness, or reliability. Any action you take upon the information on this website is strictly at your own risk.
Past performance is not indicative of future results. Investing involves risk, including the possible loss of principal. All investors should make their own decisions based on their specific investment objectives and financial circumstances.
This site may contain links to external websites that are not provided or maintained by or in any way affiliated with Ryan Mallory and/or SharePlanner. Please note that Ryan Mallory and/or SharePlanner do not guarantee the accuracy, relevance, timeliness, or completeness of any information on these external websites.
By using this website, you agree that Ryan Mallory and/or SharePlanner and any affiliated parties are not responsible for any losses or damages resulting from your use of or reliance on the information provided.
It is strongly recommended that you consult with a qualified professional before making any financial decisions.