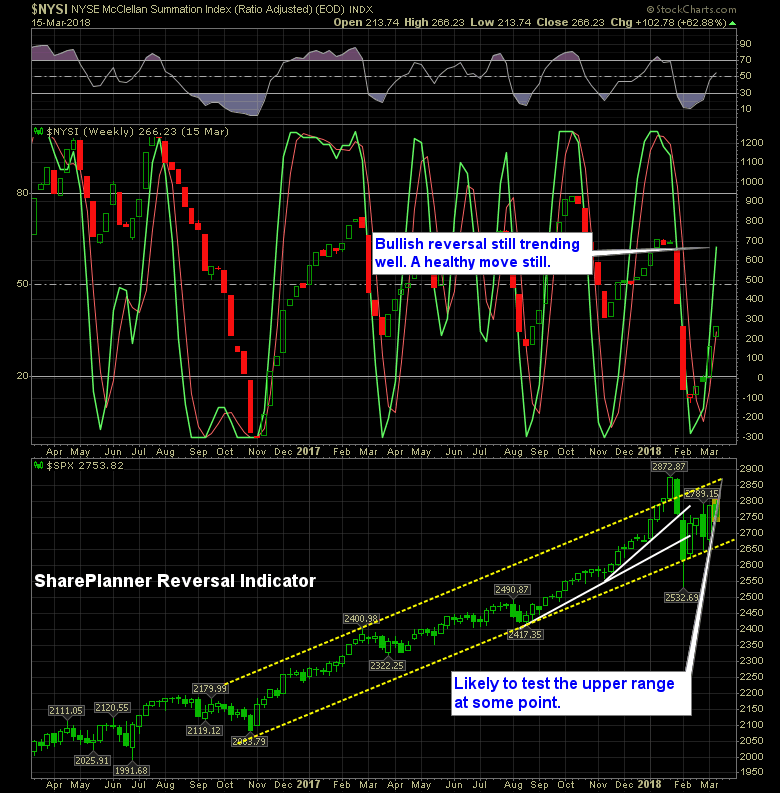
It has been a couple of weeks since we received the bullish reversal and it remains strong today. Price action this week has been less than desirable, to put it mildly, but that hasn’t affected the SharePlanner Reversal Indicator from trending bullish still.
If you glance at the indices, you wouldn’t realize the market is actually fairing poorly today. Breadth is actually negative VIX is trading 3.5% higher The percentage of stocks trading above their 40-day moving average is declining. Technology is trading lower Small Caps are in the red
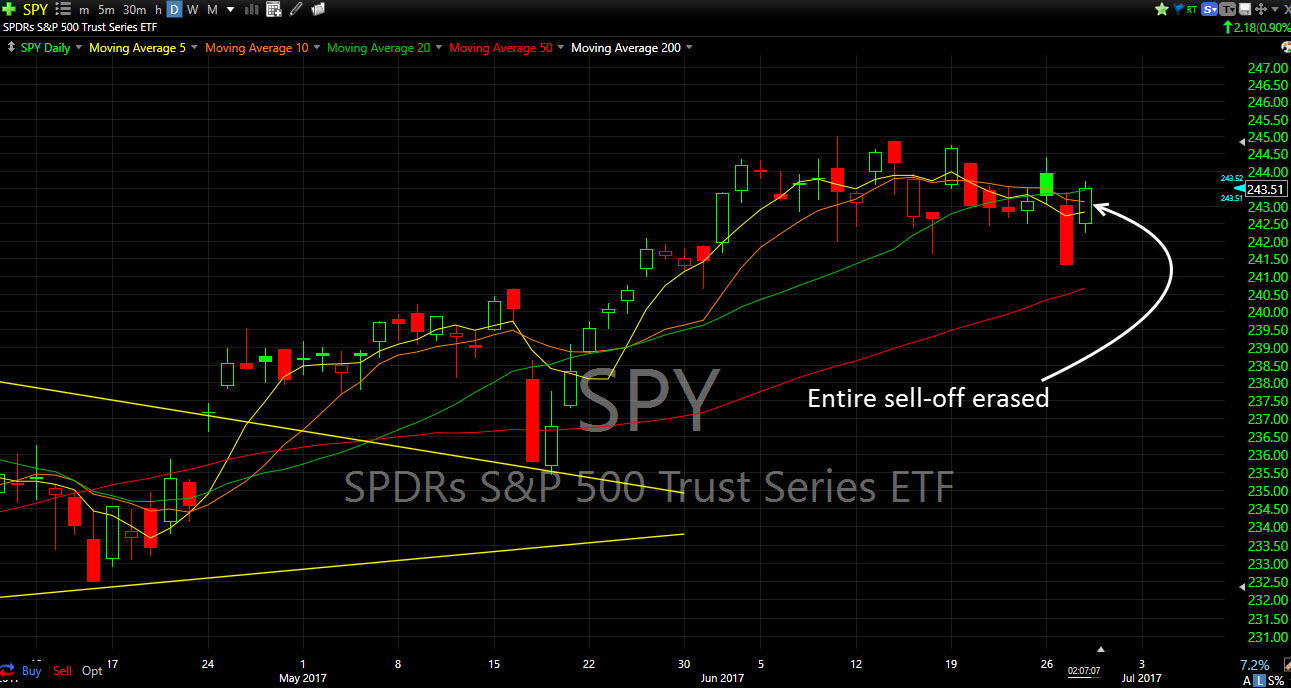
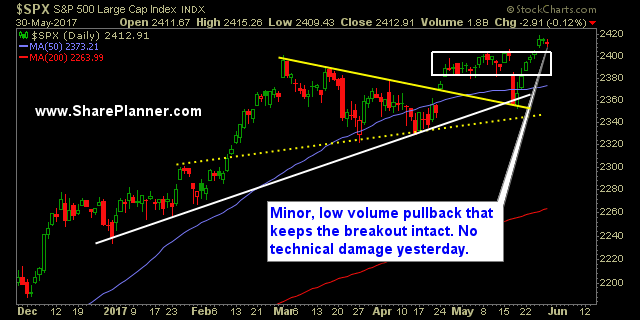
I barely remember the sell-off that ‘alledgedly’ happened yesterday. People say that there was one, but I can’t take their word for certain. The buy-the-dip crowd would never allow such a thing. Don’t believe me? Take a look at the charts below – nothing ever happened yesterday. S&P 500 (SPY) Dip Buy Nasdaq (QQQ) Dip Buy
Instead of “Sell in May”, it is “Snooze in May” But more to the extent that the market is simply lacking the participants for big moves. There has only been one move so far this month that was in excess of 1%. But really, this market has been extremely flat since March. Nonetheless though, we

One last thought about bitcoin Okay, I want to go this whole week without mentioning bitcoin, crap I just mentioned it and even titled this post after it, so lets go ahead and throw that idea out the window, because it was over before it ever got started.

New All-Time Highs – Everything is fine…or should I worry? It is like the market is a sling-shot. Last Wednesday’s sell-off represents the moment where the sling gets pulled back, really hard, and the subsequent six days of buying in the market represents the market ‘letting go of the drawn sling and watching it propel

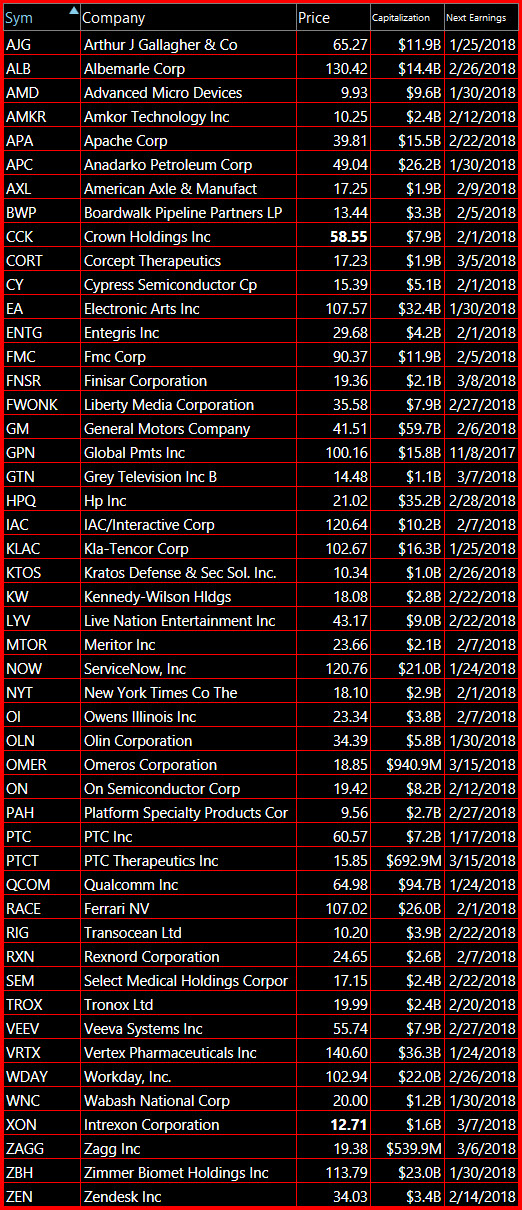
Take a look at these bearish trade setups Maybe the market will finally correct. Who knows!?! The resiliency of the market is a thing to behold. Honestly though, it just takes $10 trillion of endless QE worldwide and you can prop anything up. Nonetheless, the charts look bearish, the S&P 500 acts like it wants

Here is wher you can find yourself a bullish trade setup The market has traded lower for most of the day, but after a hard sell-off early on, it is attempting to stage its own recovery. If that happens, you have a whole list of bullish trade setups below that you can trade off of.
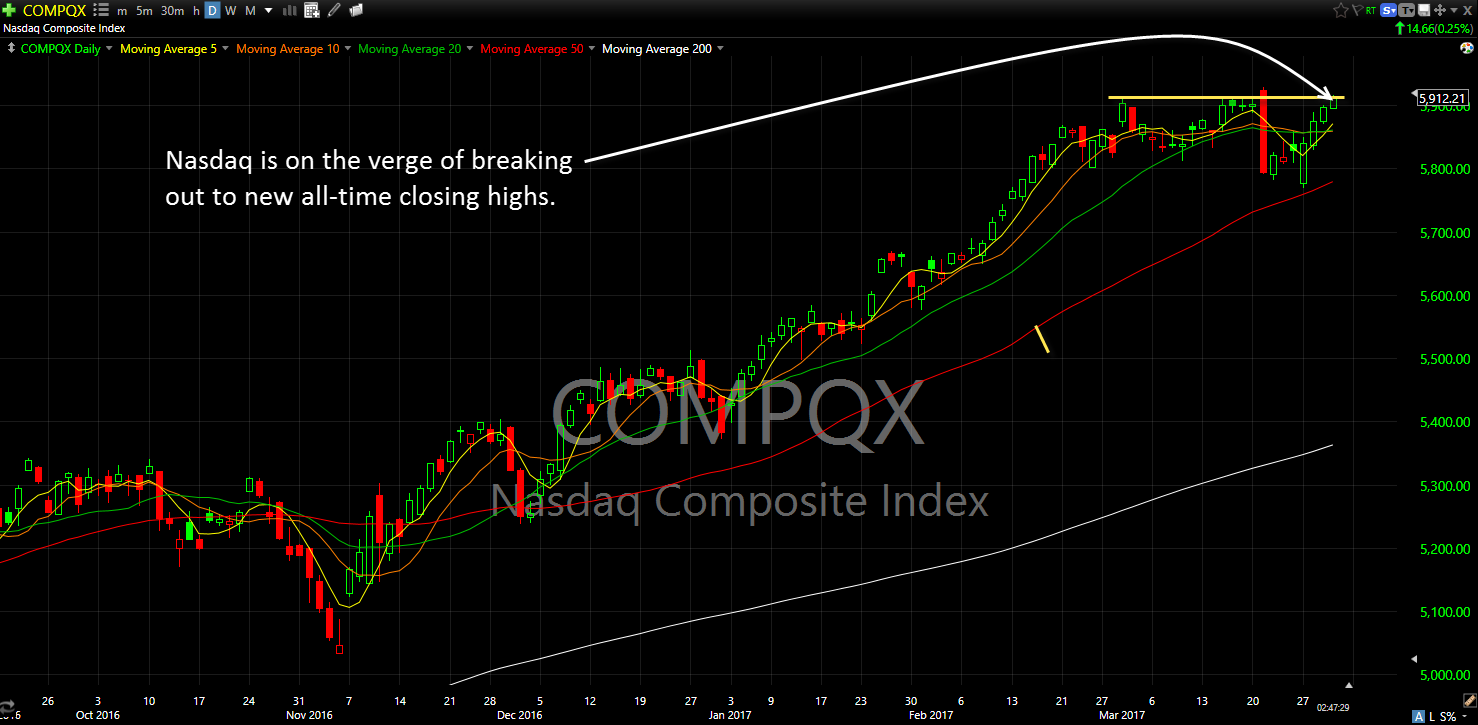
The Nasdaq Close was based on closing price not intraday all-time highs. That close for the Nasdaq is a good thing for the bulls and the rest of the market, because the Nasdaq has been leading the way for the past few months. And by hitting new closing highs, it increases the odds that the

spc@shareplanner.com
(904) 800-8420
© Copyright 2025 | SharePlanner Inc. All Rights Reserved.
Disclaimer: The information provided on this website is for educational and informational purposes only. Ryan Mallory and/or SharePlanner are not licensed financial advisors, brokers, or tax professionals. The content on this site should not be considered as financial, investment, tax, or legal advice.
All information and opinions expressed herein are based on sources believed to be accurate and reliable. However, we make no representation or warranty as to their accuracy, completeness, or reliability. Any action you take upon the information on this website is strictly at your own risk.
Past performance is not indicative of future results. Investing involves risk, including the possible loss of principal. All investors should make their own decisions based on their specific investment objectives and financial circumstances.
This site may contain links to external websites that are not provided or maintained by or in any way affiliated with Ryan Mallory and/or SharePlanner. Please note that Ryan Mallory and/or SharePlanner do not guarantee the accuracy, relevance, timeliness, or completeness of any information on these external websites.
By using this website, you agree that Ryan Mallory and/or SharePlanner and any affiliated parties are not responsible for any losses or damages resulting from your use of or reliance on the information provided.
It is strongly recommended that you consult with a qualified professional before making any financial decisions.