
Technology and Small Caps are the market leaders.
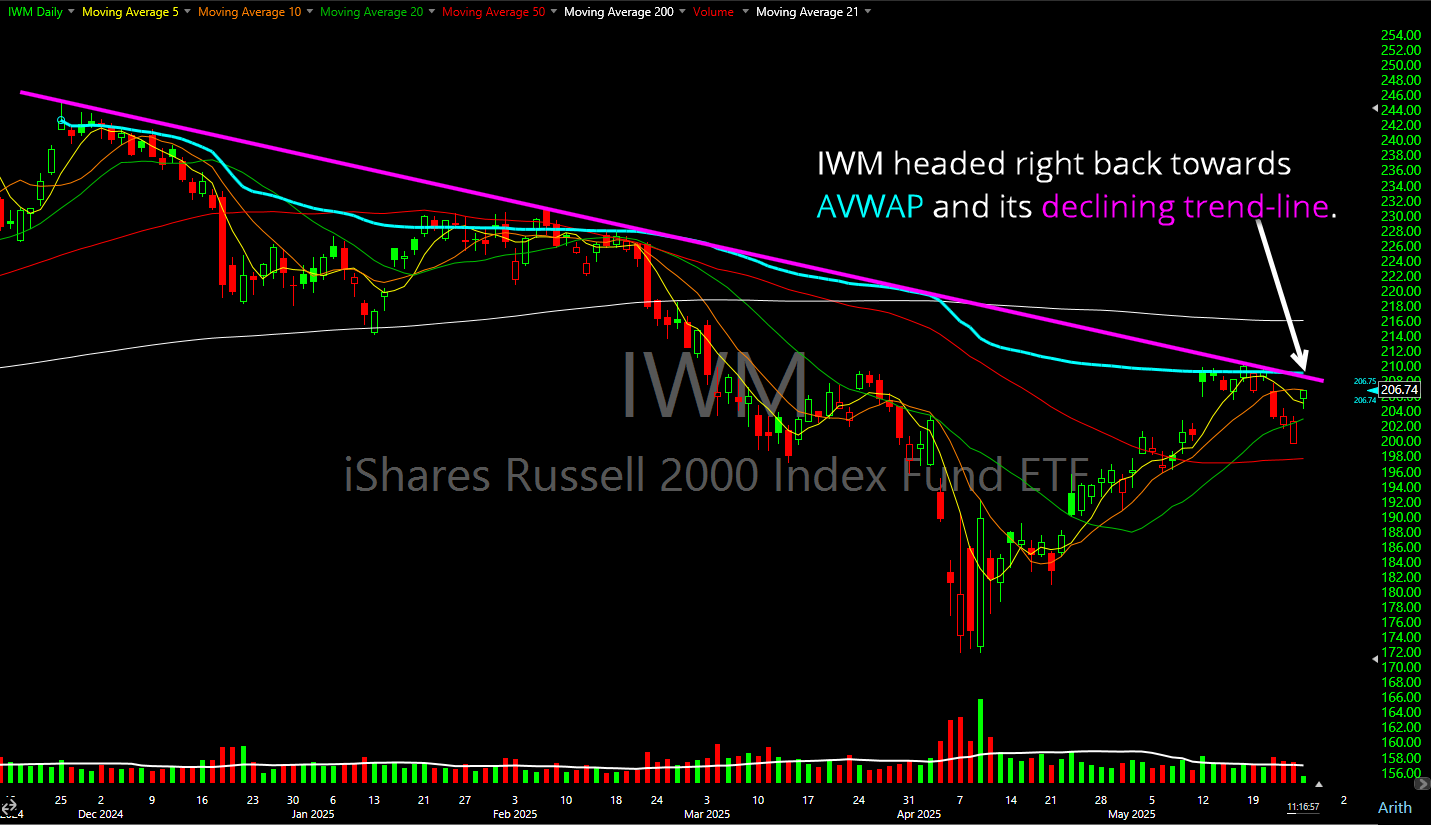
Russell 2000 ETF (IWM) struggling big time with declining resistance and looks set to test it again.

Heaviest short interest, by a long shot, in the last six years.

Crazy One-Day Sell-off for Stocks! The stock market just got rocked with SPY dropping almost 5%, and the Nasdaq plunging 5.4%. Is this the start of a bigger crash, or just a sharp correction? In this video, I break down the technical analysis behind today's sell-off, covering key support and resistance levels, and discuss what

Since 2/17 IWM has been trading sideways on the 30 minute chart, but getting closer to a breakout here.

Understanding a Counter Trend Rally The Importance of Context in Trend Analysis Let’s talk about a counter trend rally as it applies to the stock market. The SPDR S&P 500 Trust ETF (SPY) mirrors the S&P 500 and its price action and for swing traders trying to predict and capture its price swings and
No, the stock market crashing - at least not yet! The stock market is not crashing right now and the question that should be asked is not whether the stock market is crashing, but how are we going to respond to what the stock market does next. In this video, I provide my technical analysis

Market Rotation Into Small caps is unfolding. IWM ETF appears to be set to make another rally here to the upside as the market rotation into small caps continues. Russell 2000 (IWM) pulled back late last week and is now bouncing off of the Fibonacci retracement levels and sets up for a potential rally
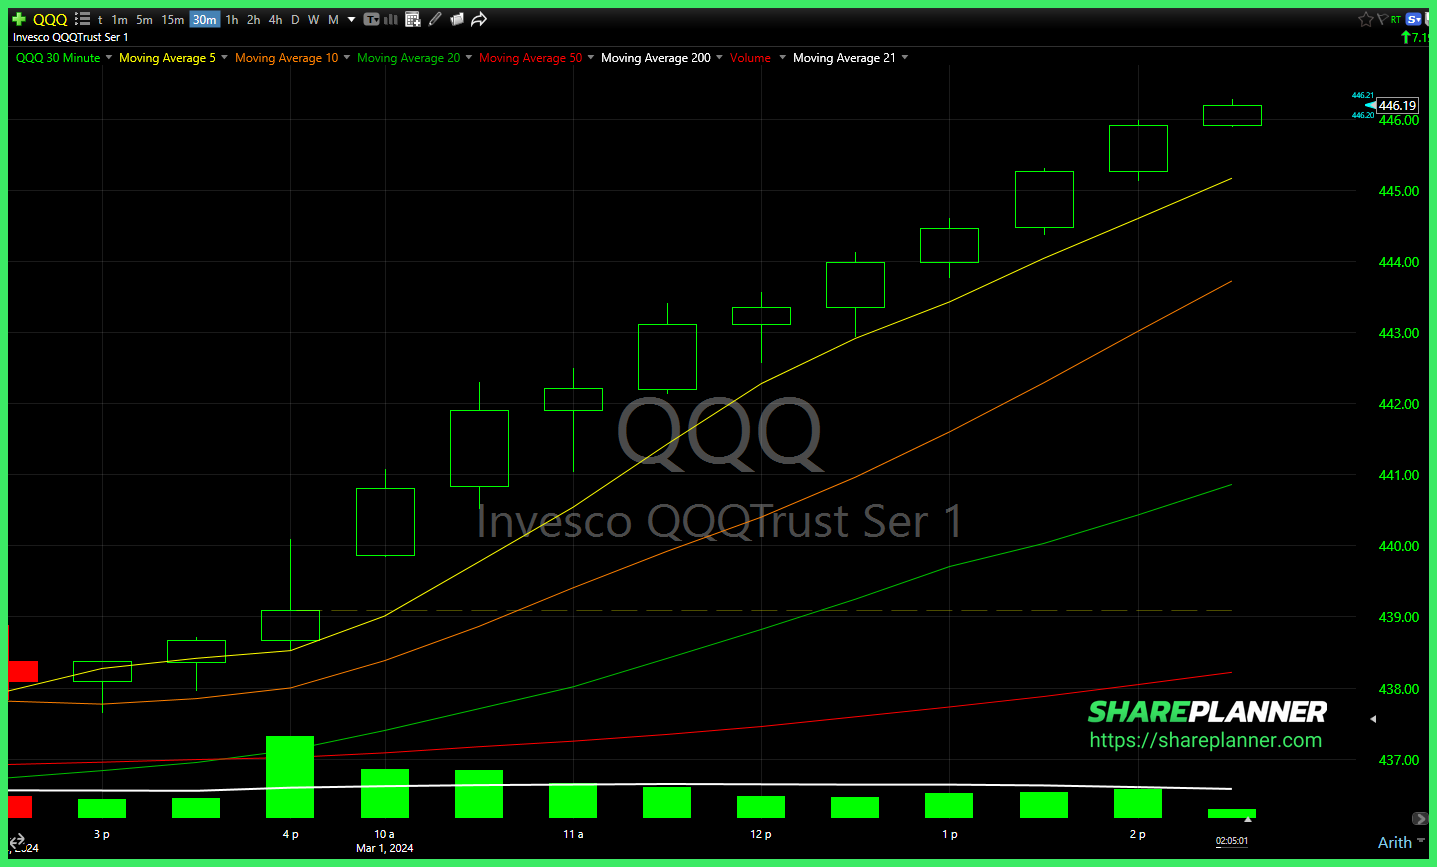
Nasdaq 100 (QQQ) 30 min chart will zero chill in it. Another breakout attempt unfolding on Russell 2000 (IWM) today. A solid push through resistance so far. If US Global Jets ETF (JETS) breaks out of the continuation triangle, then it has to immediately contend with long-term declining resistance. A no-go for me. Heavy resistance
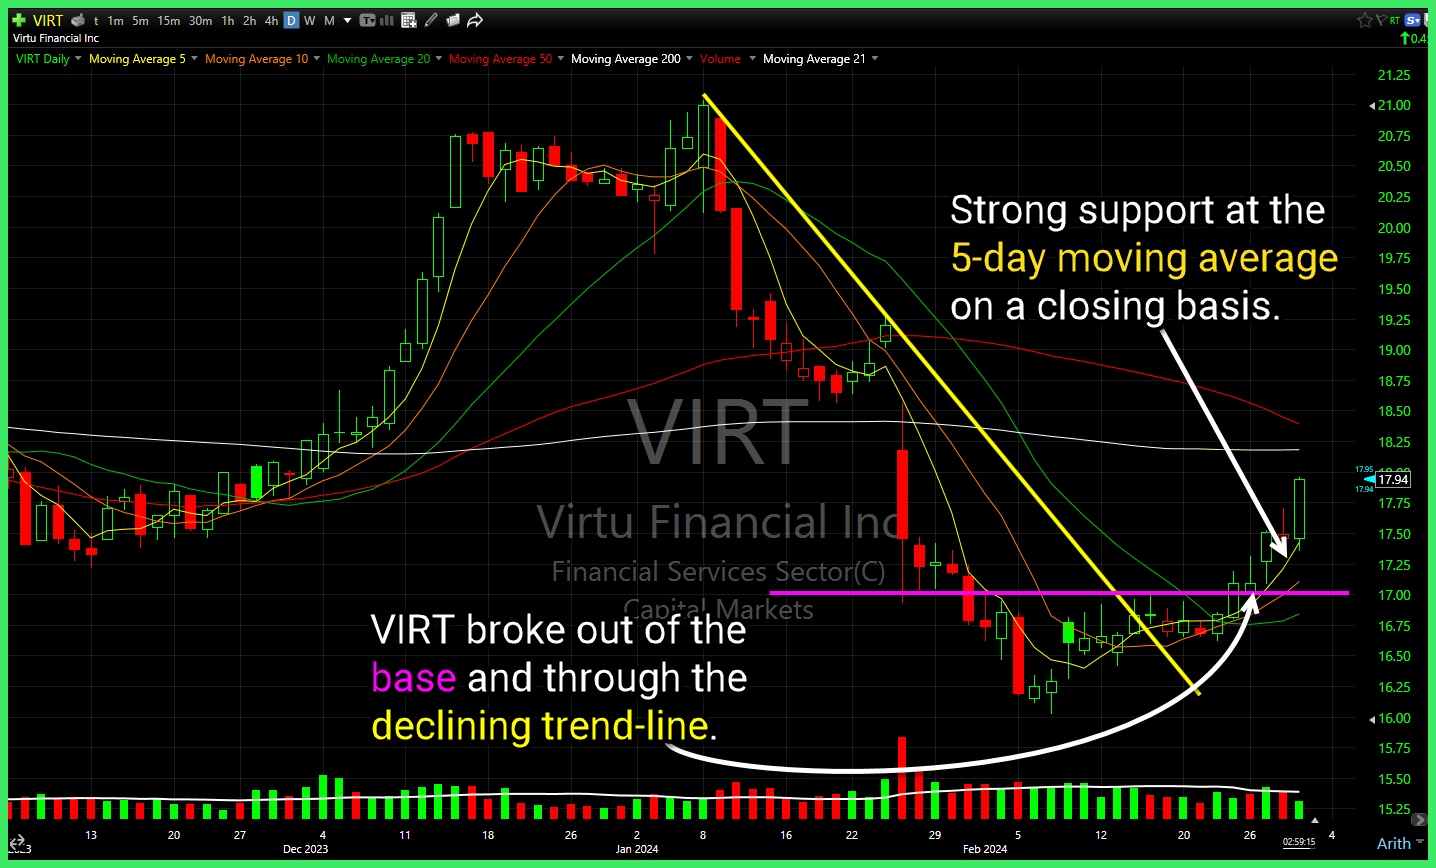
$VIRT broke out of the base and through the declining trend-line. . $IWM gapped above resistance today, and has since pulled back for a retest. Watching here to see whether that level holds, or if it starts to fade and close the gap from this morning. Bull flag in $WYNN attempting to breakout. Rising trend-line

spc@shareplanner.com
(904) 800-8420
© Copyright 2025 | SharePlanner Inc. All Rights Reserved.
Disclaimer: The information provided on this website is for educational and informational purposes only. Ryan Mallory and/or SharePlanner are not licensed financial advisors, brokers, or tax professionals. The content on this site should not be considered as financial, investment, tax, or legal advice.
All information and opinions expressed herein are based on sources believed to be accurate and reliable. However, we make no representation or warranty as to their accuracy, completeness, or reliability. Any action you take upon the information on this website is strictly at your own risk.
Past performance is not indicative of future results. Investing involves risk, including the possible loss of principal. All investors should make their own decisions based on their specific investment objectives and financial circumstances.
This site may contain links to external websites that are not provided or maintained by or in any way affiliated with Ryan Mallory and/or SharePlanner. Please note that Ryan Mallory and/or SharePlanner do not guarantee the accuracy, relevance, timeliness, or completeness of any information on these external websites.
By using this website, you agree that Ryan Mallory and/or SharePlanner and any affiliated parties are not responsible for any losses or damages resulting from your use of or reliance on the information provided.
It is strongly recommended that you consult with a qualified professional before making any financial decisions.