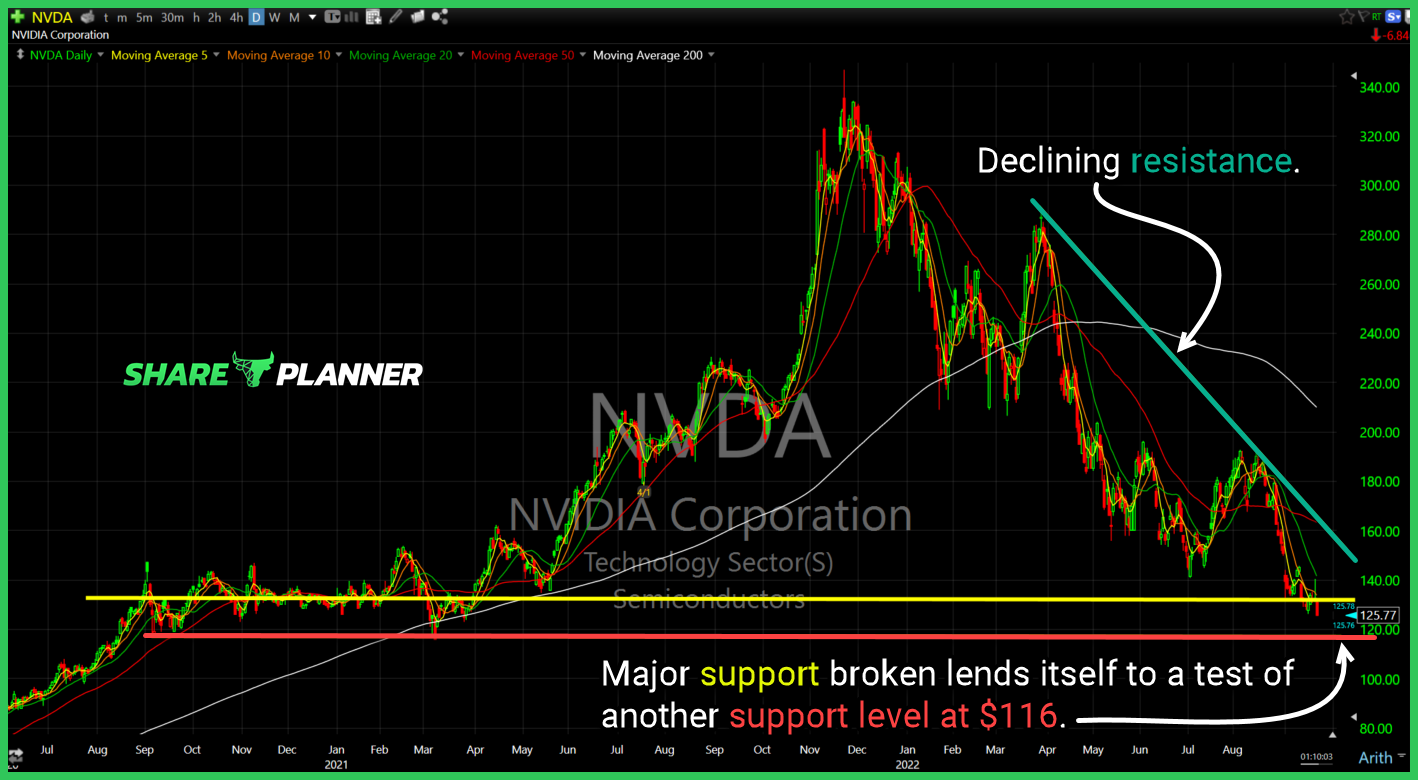
$NVDA major support broken lends itself to a test of another support level at $116.
The CPI Report has jump started what is turning into another stock market crash. Stocks had their worst week in over 8 months and now looks to test the stock market lows. Will the stock market crash continue or will it find support and form a double bottom? In this video, I provide my analysis

$XLE barely held support for a second straight day.
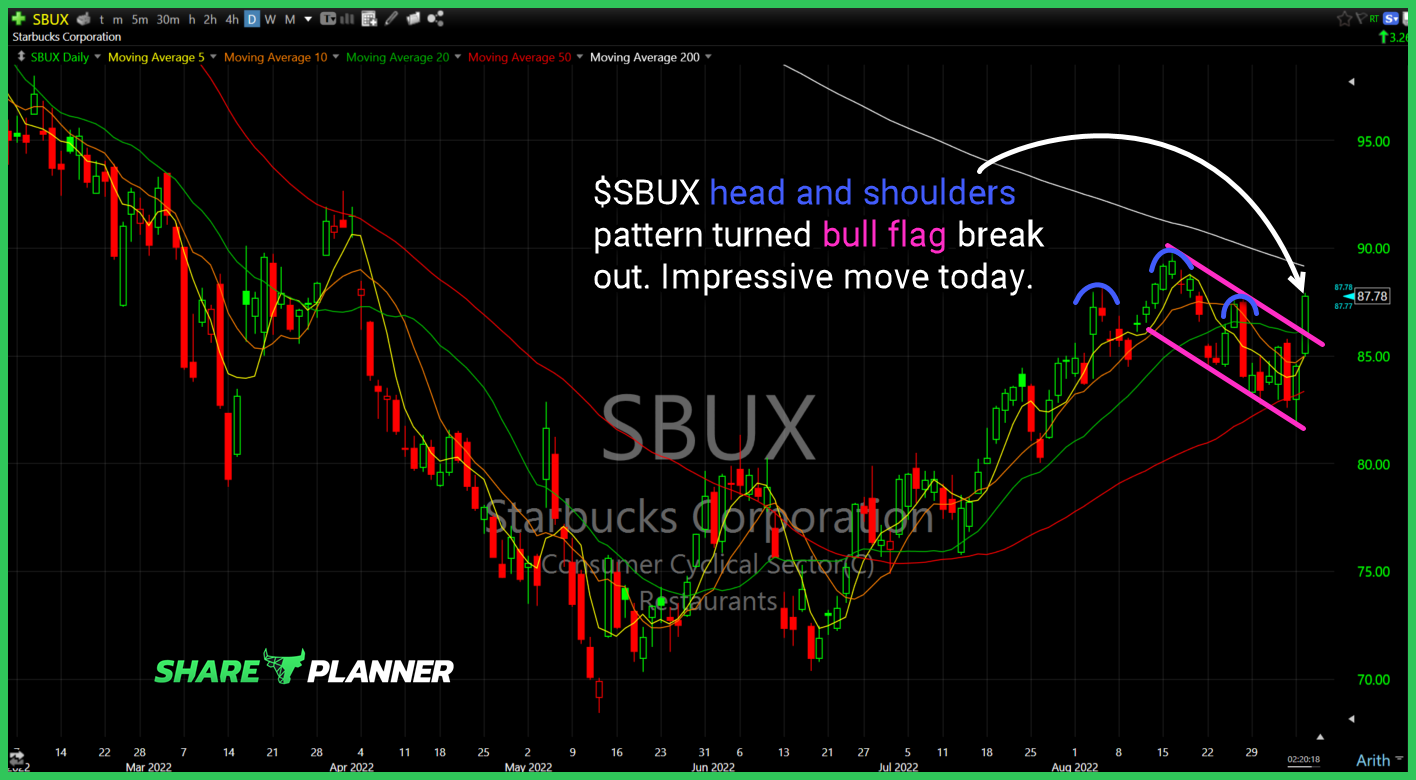
$SBUX head and shoulders pattern turned bull flag breakout. Impressive move today.
Since I last warned the next leg of the stock market crash was upon us, there has been a 10% move lower across the stock market. Are stocks going back down and testing the recent lows, or will it quickly reverse and the stock market finally find a bottom? In this video, I provide my

$WEAT setting up again as a breakout play.

$XLRE pulling back to its short-term, rising trend-line. Watch to see if it can muster a bounce.

$COST holding on to the rising trend-line here. Watch for a potential bounce.
Talk of another stock market crash is upon us. With SPY ETF dropping over 4% in the last two trading sessions, the dead cat bounce / bear market rally appears to be over. Will stocks retest the lows from June, or is there hope for the dip buyers to rescue the stock market from what

spc@shareplanner.com
(904) 800-8420
© Copyright 2025 | SharePlanner Inc. All Rights Reserved.
Disclaimer: The information provided on this website is for educational and informational purposes only. Ryan Mallory and/or SharePlanner are not licensed financial advisors, brokers, or tax professionals. The content on this site should not be considered as financial, investment, tax, or legal advice.
All information and opinions expressed herein are based on sources believed to be accurate and reliable. However, we make no representation or warranty as to their accuracy, completeness, or reliability. Any action you take upon the information on this website is strictly at your own risk.
Past performance is not indicative of future results. Investing involves risk, including the possible loss of principal. All investors should make their own decisions based on their specific investment objectives and financial circumstances.
This site may contain links to external websites that are not provided or maintained by or in any way affiliated with Ryan Mallory and/or SharePlanner. Please note that Ryan Mallory and/or SharePlanner do not guarantee the accuracy, relevance, timeliness, or completeness of any information on these external websites.
By using this website, you agree that Ryan Mallory and/or SharePlanner and any affiliated parties are not responsible for any losses or damages resulting from your use of or reliance on the information provided.
It is strongly recommended that you consult with a qualified professional before making any financial decisions.