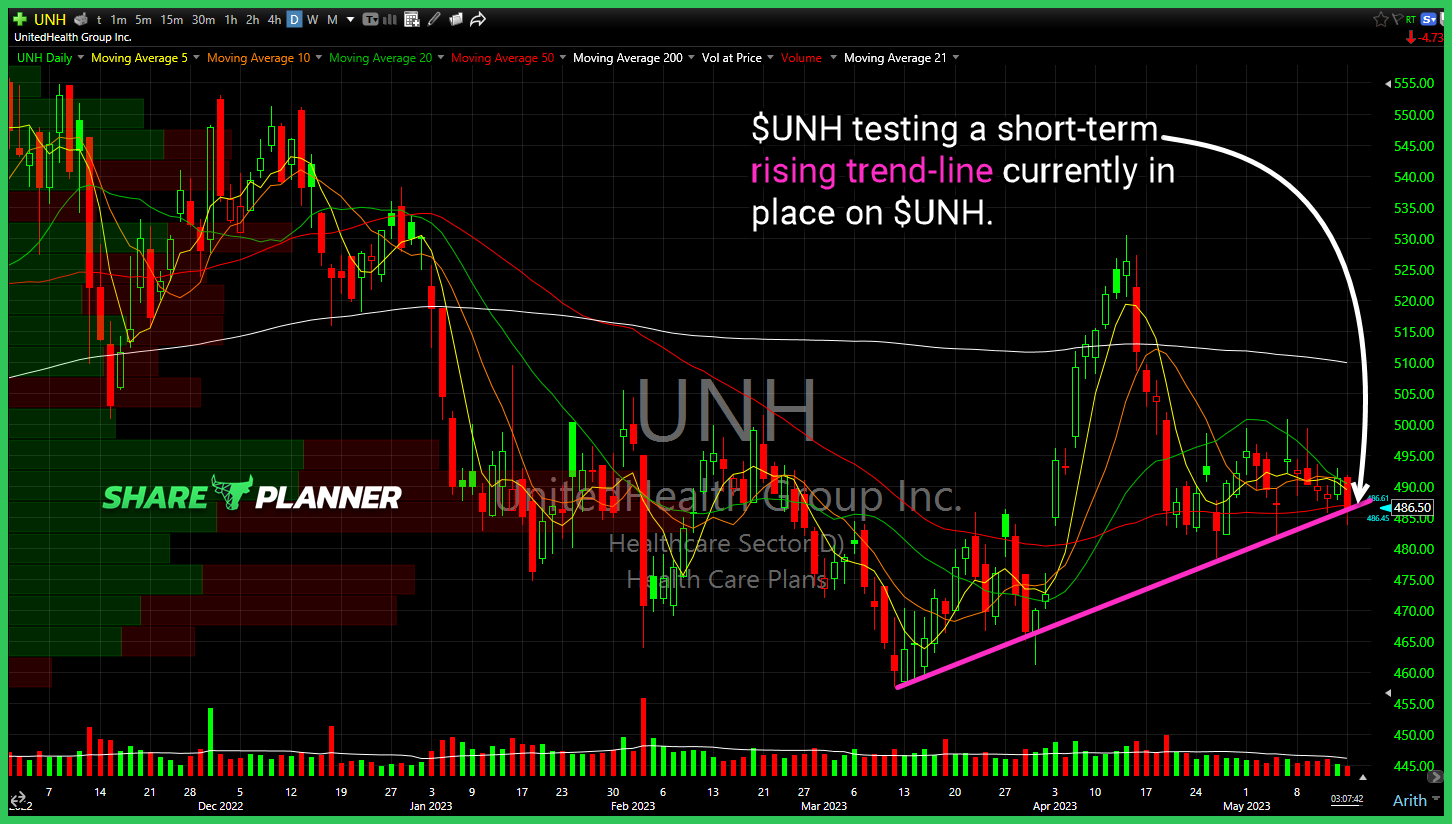
$UNH testing a short-term rising trend-line currently in place on $UNH.
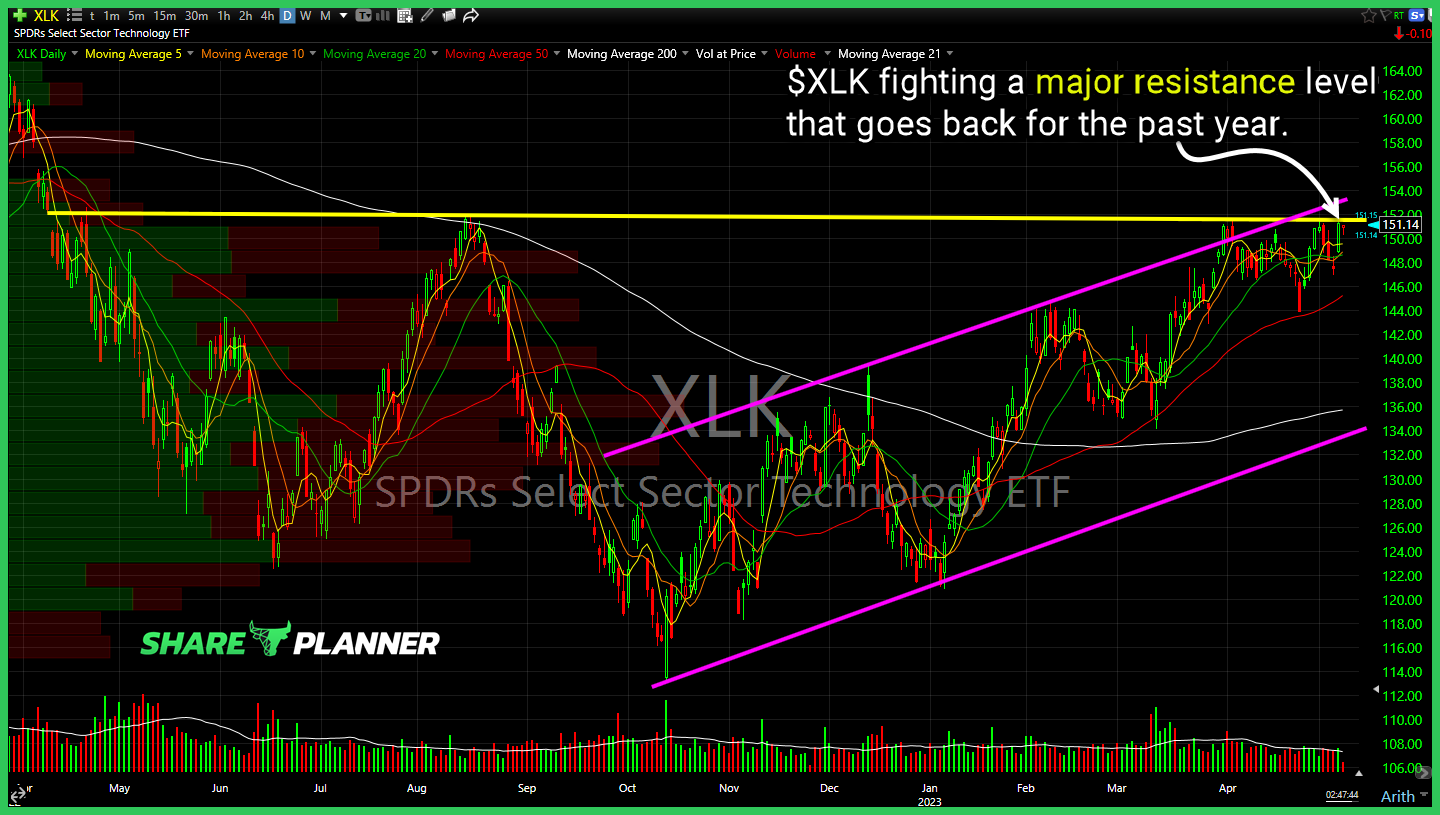
$XLK fighting a major resistance level that goes back for the past year.
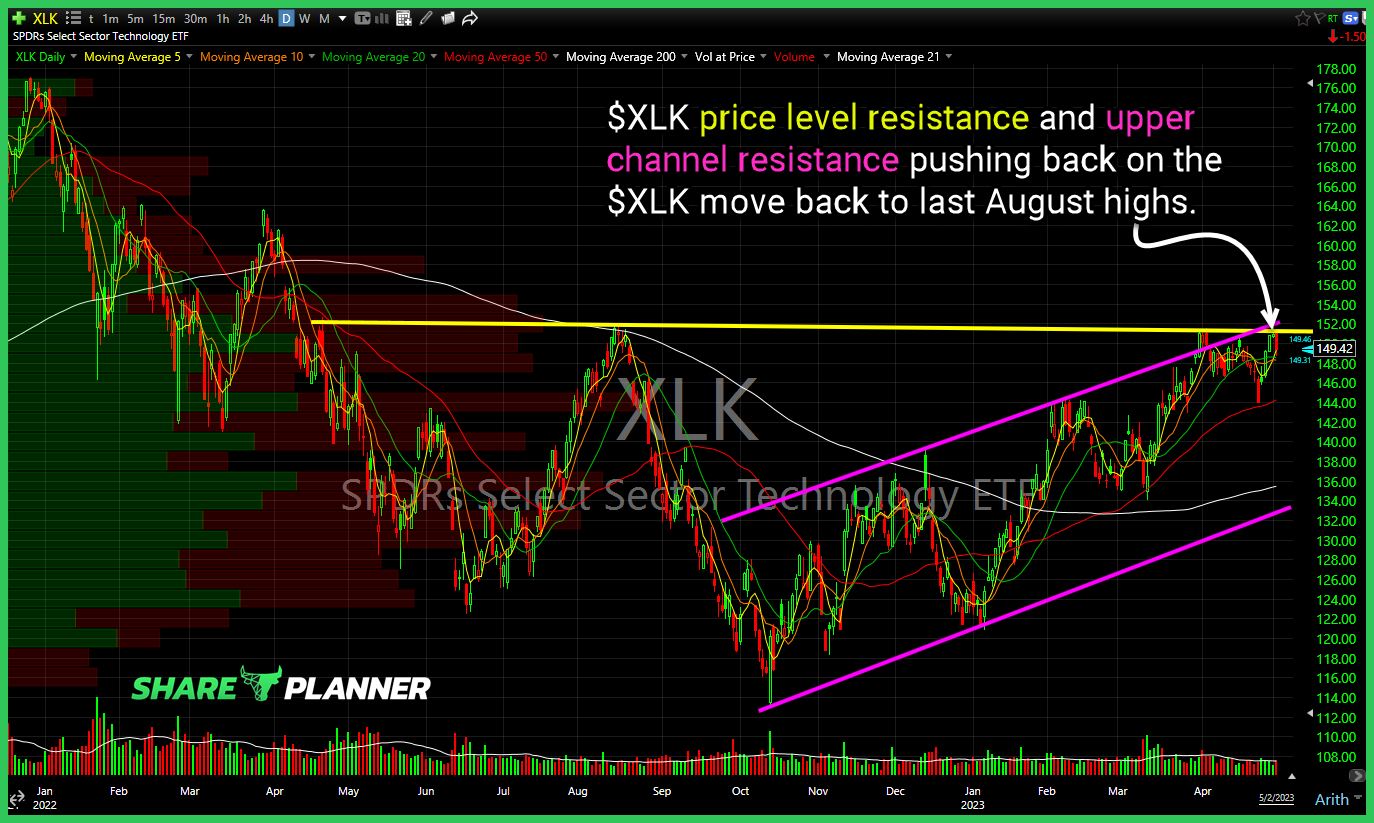
$XLK price level resistance and upper channel resistance pushing back on the $XLK move back to last August highs.

The tech rally in the Nasdaq 100 has been spectacular, but can it continue the momentum of the past few weeks and keep rally going? In this video, I am providing my Nasdaq 100 analysis using the QQQ ETF chart, as well as going over the big tech stocks and how they might be signifying
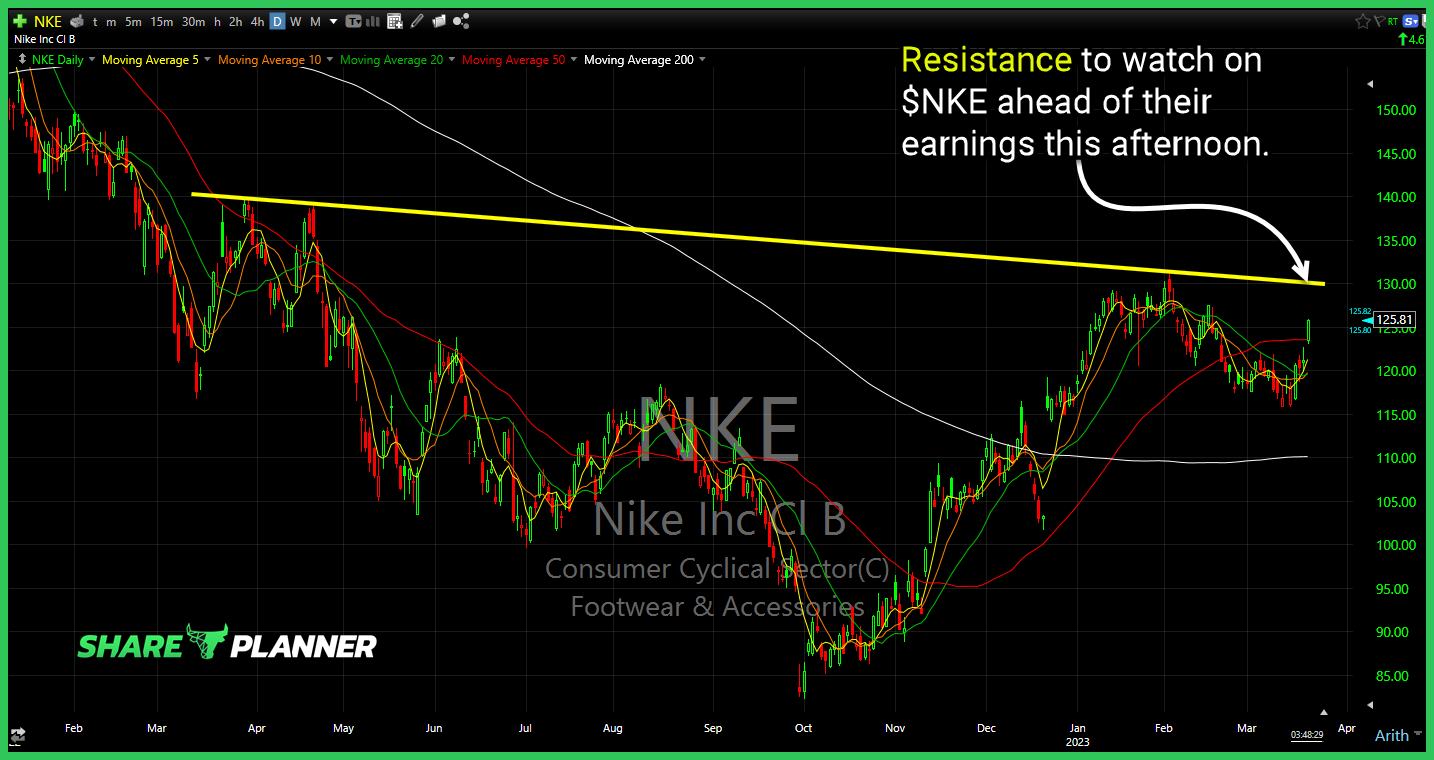
Resistance to watch on $NKE ahead of their earnings this afternoon.
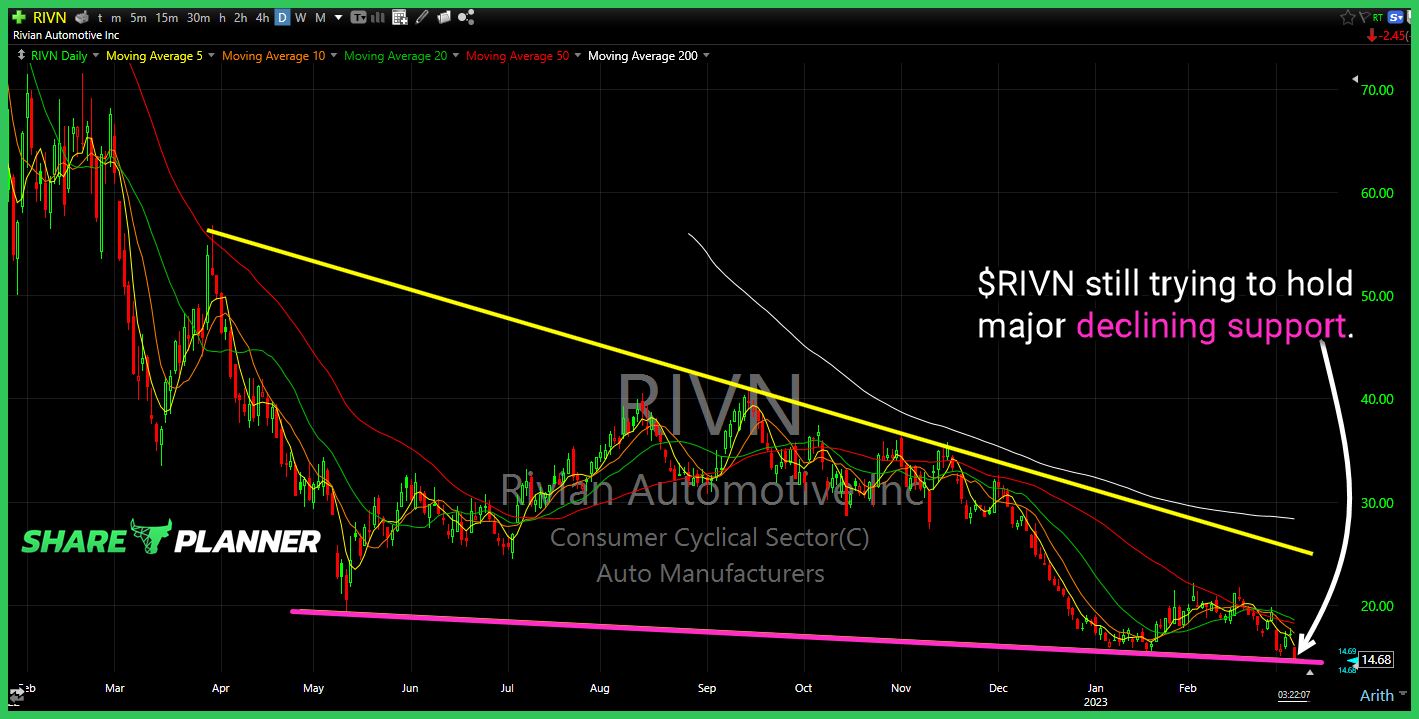
$RIVN still trying to hold major declining support.

Stock market pullback back lasted for the past two days. Using technical analysis, is now the time to buy the dip, or wait for stocks to sell off even further before considering buying stocks?

The stock market ripped higher following the FOMC Statement issued by Jerome Powell. The stock market soared, and from a technical analysis standpoint, the outlook looks good for stocks going forward. In this video, I provide my analysis on the SPY, QQQ and IWM ETF, as well as my outlook on the VIX index.
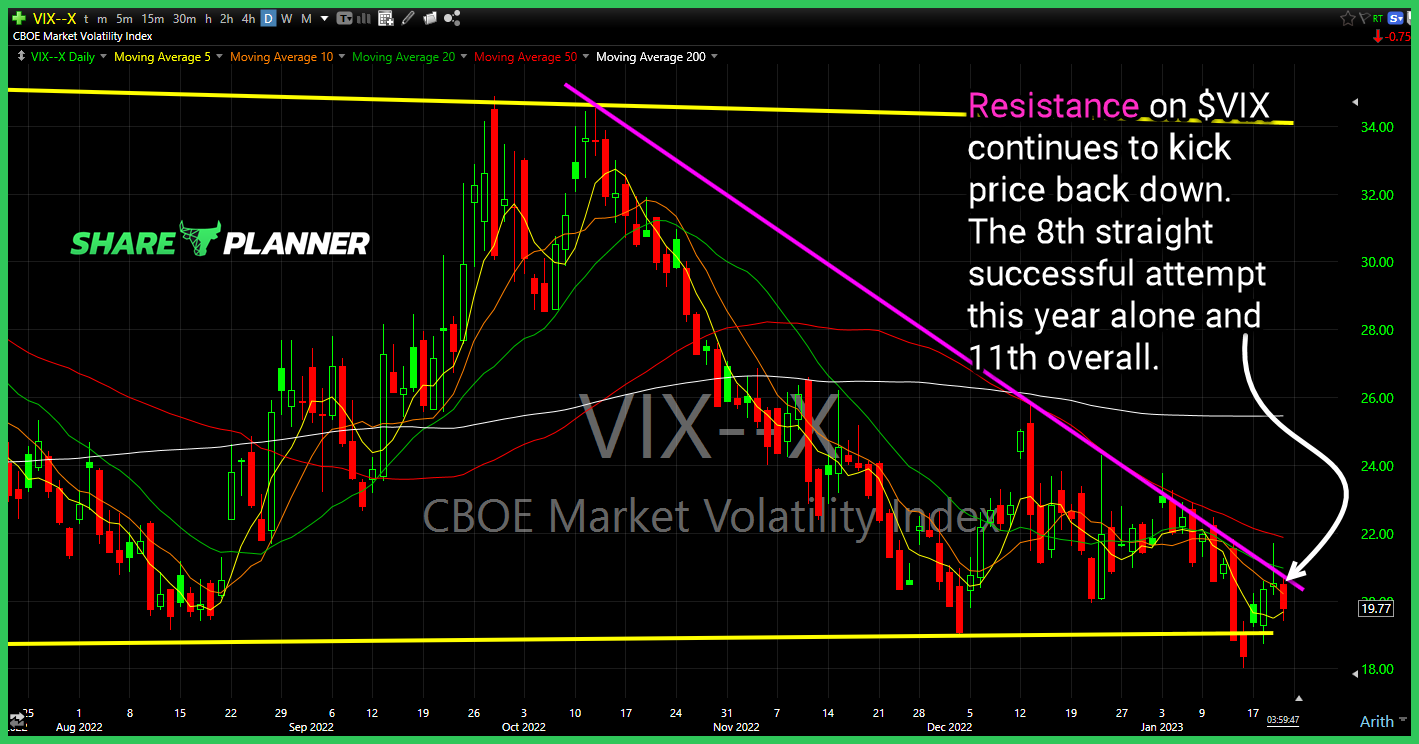
Resistance on $VIX continues to kick price back down. The 8th straight successful attempt this year alone and 11th overall.
Which sector provides the best opportunity for traders in 2023? In this video, I provide my technical analysis and opinion on each sector in the stock market and which ones are likely to do the best, while which ones are most likely to lag the over all market.

spc@shareplanner.com
(904) 800-8420
© Copyright 2025 | SharePlanner Inc. All Rights Reserved.
Disclaimer: The information provided on this website is for educational and informational purposes only. Ryan Mallory and/or SharePlanner are not licensed financial advisors, brokers, or tax professionals. The content on this site should not be considered as financial, investment, tax, or legal advice.
All information and opinions expressed herein are based on sources believed to be accurate and reliable. However, we make no representation or warranty as to their accuracy, completeness, or reliability. Any action you take upon the information on this website is strictly at your own risk.
Past performance is not indicative of future results. Investing involves risk, including the possible loss of principal. All investors should make their own decisions based on their specific investment objectives and financial circumstances.
This site may contain links to external websites that are not provided or maintained by or in any way affiliated with Ryan Mallory and/or SharePlanner. Please note that Ryan Mallory and/or SharePlanner do not guarantee the accuracy, relevance, timeliness, or completeness of any information on these external websites.
By using this website, you agree that Ryan Mallory and/or SharePlanner and any affiliated parties are not responsible for any losses or damages resulting from your use of or reliance on the information provided.
It is strongly recommended that you consult with a qualified professional before making any financial decisions.