No, the stock market crashing - at least not yet! The stock market is not crashing right now and the question that should be asked is not whether the stock market is crashing, but how are we going to respond to what the stock market does next. In this video, I provide my technical analysis

Buy the dip in semiconductor stock? Semiconductor stocks have plummeted over the past month. Is it now time to buy the dip in semiconductor stocks like Nvidia (NVDA) and Advanced Micro Devices (AMD), among others? In this video I discuss the potential for a bounce within semiconductor stocks and the SMH ETF as well as

Market Rotation Into Small caps is unfolding. IWM ETF appears to be set to make another rally here to the upside as the market rotation into small caps continues. Russell 2000 (IWM) pulled back late last week and is now bouncing off of the Fibonacci retracement levels and sets up for a potential rally

An ascending triangle chart pattern is commonly used in technical analysis and considered to be bullish. The ascending triangle is a technical pattern that pops up often signifying a continuation of the existing trend-line if it manages to break out of the ascending triangle. In this video I analyze the ascending triangle breakout in

RSP is an ETF that represents all of the stocks in the S&P 500 with an equal weighting. It is important to understand the key difference in RSP vs. SPY. SPY holds the same stocks but does it with a weighting according each stock's overall market cap. This key difference has resulted in drastic differences

How to swing trade a gravestone doji candle: Is it a stock market rally killer? In this video I will go over the gravestone doji candle pattern that has formed on the Nasdaq 100 (QQQ) weekly chart and what that means for stocks in general, as well as analyze how it has impacted the

My Swing Trading Strategy I closed out my short position in Western Digital Corp (WDC) for a a +3.1% profit. Market pointed lower this morning, but I’m more interested in seeing how long the bears can hold the early losses and whether the bulls step in and buy the dip once again as seen on Friday

My Swing Trading Strategy Busy day yesterday, I started the day out long and strong, and just following price action, managed to somehow end the day with just a short position remaining in the portfolio. I closed Tesla (TSLA) for a +4.6% profit, then I closed Alibaba (BABA) for a +2.1% profit, McDonald’s (MCD) for a +1% profit and a Day-Trade in Square
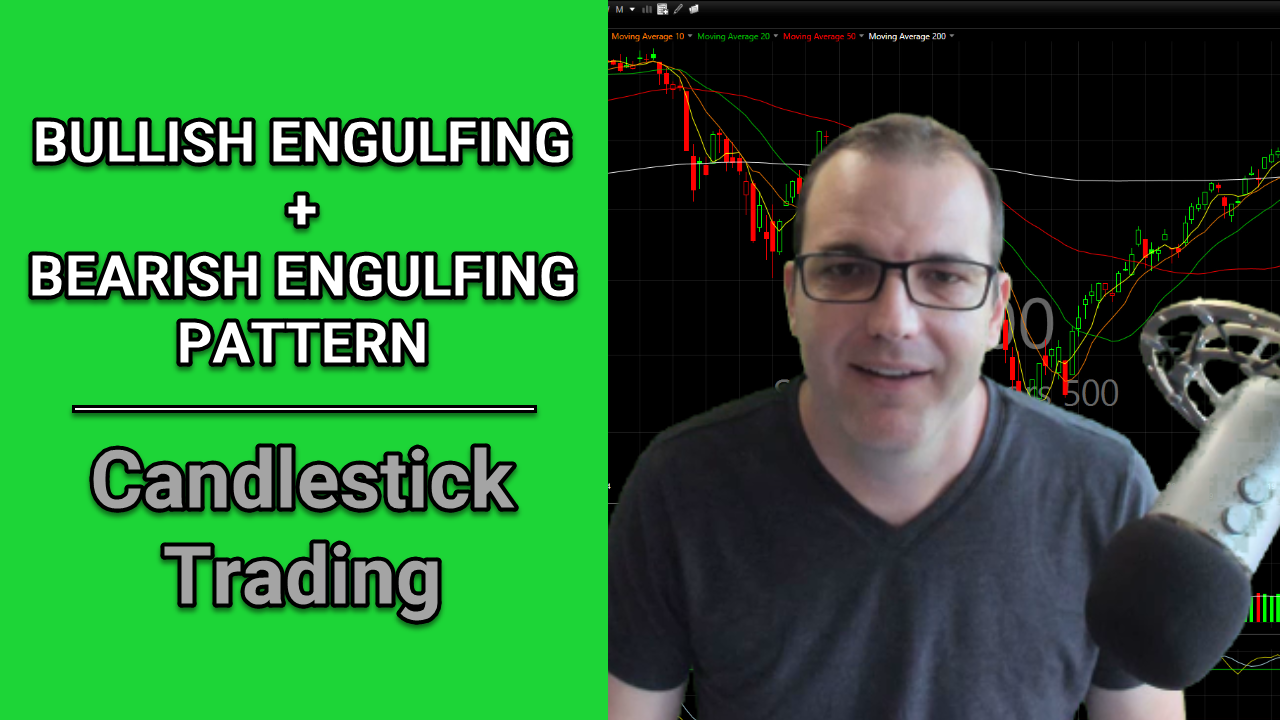
The bullish engulfing candlestick pattern is composed of two candle lines. The first one is a red one, and the second one is a green one that is bigger than the prior candle, thereby engulfing the entire body of the previous candle. The bearish engulfing candlestick pattern is composed of two candle lines. The first
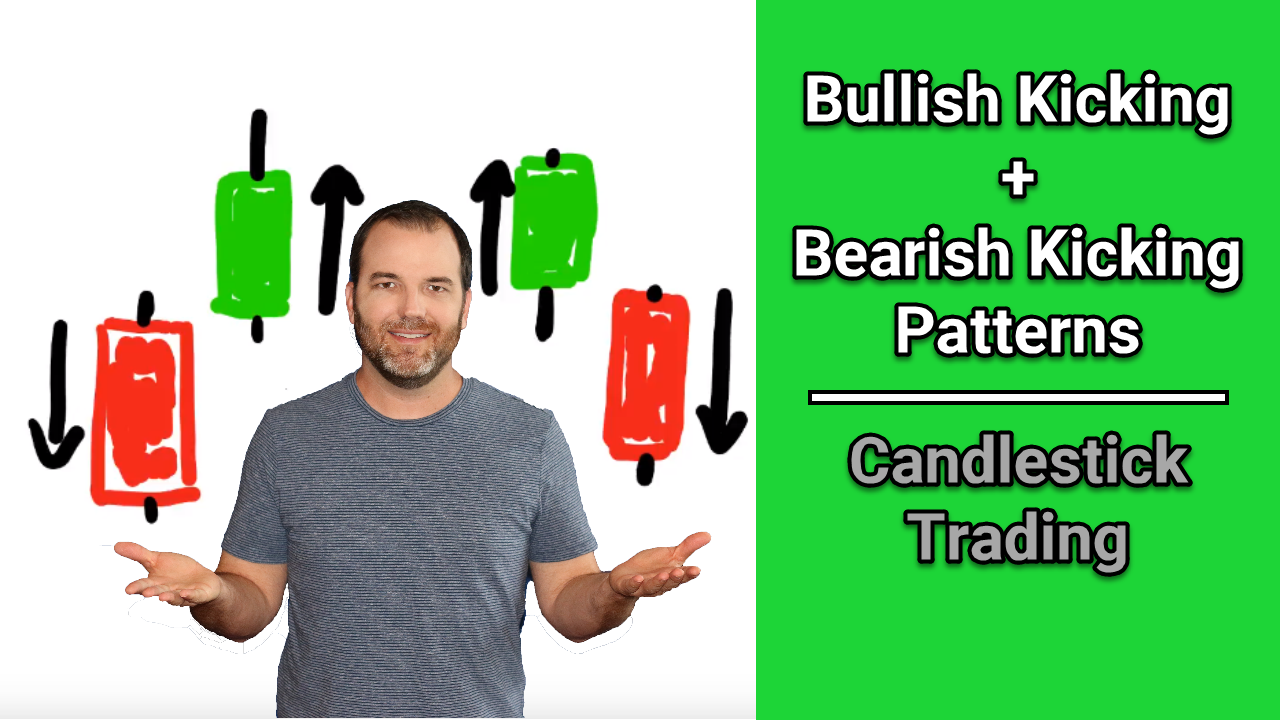
The bullish kicking candlestick pattern is composed of two candlesticks: a red one (down) as the first candle followed by a green (up) one with an gap in between. The bullish kicking candlestick acts as a bullish reversal pattern when conducting technical analysis. For the bearish kicker, it is the exact opposite. Check it out:

spc@shareplanner.com
(904) 800-8420
© Copyright 2025 | SharePlanner Inc. All Rights Reserved.
Disclaimer: The information provided on this website is for educational and informational purposes only. Ryan Mallory and/or SharePlanner are not licensed financial advisors, brokers, or tax professionals. The content on this site should not be considered as financial, investment, tax, or legal advice.
All information and opinions expressed herein are based on sources believed to be accurate and reliable. However, we make no representation or warranty as to their accuracy, completeness, or reliability. Any action you take upon the information on this website is strictly at your own risk.
Past performance is not indicative of future results. Investing involves risk, including the possible loss of principal. All investors should make their own decisions based on their specific investment objectives and financial circumstances.
This site may contain links to external websites that are not provided or maintained by or in any way affiliated with Ryan Mallory and/or SharePlanner. Please note that Ryan Mallory and/or SharePlanner do not guarantee the accuracy, relevance, timeliness, or completeness of any information on these external websites.
By using this website, you agree that Ryan Mallory and/or SharePlanner and any affiliated parties are not responsible for any losses or damages resulting from your use of or reliance on the information provided.
It is strongly recommended that you consult with a qualified professional before making any financial decisions.