
If we were truly honest with ourselves, I think most of us would admit that at some point, we haven’t traded within our means. That doesn’t make you a bad trader or a reckless person. It just means you are human. The stock market has a way of distorting our reality and inflating our expectations
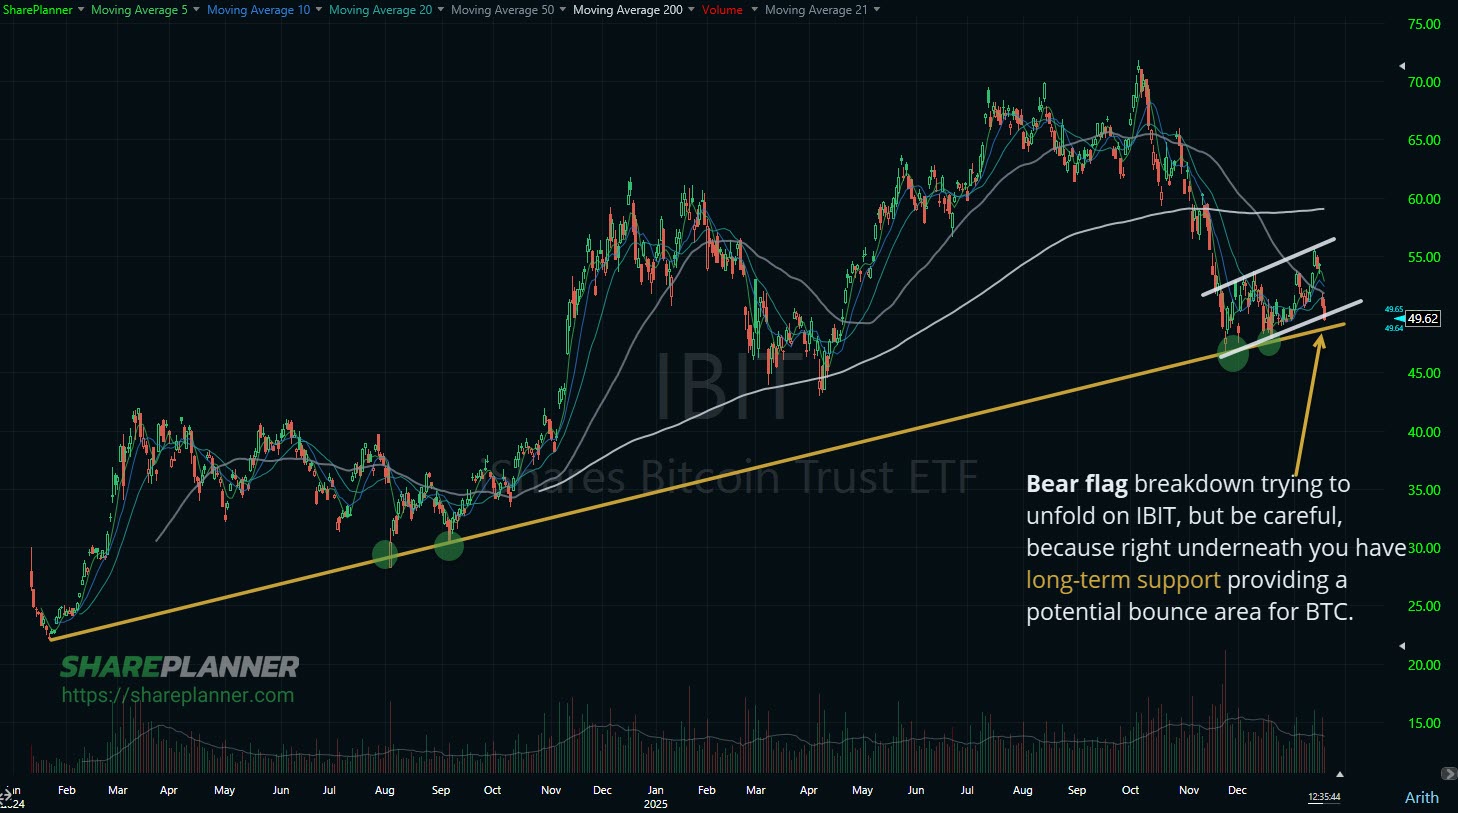
Not sure this is the bear flag you want to play on Bitcoin (BTC) with long-term support underneath (using the IBIT chart).
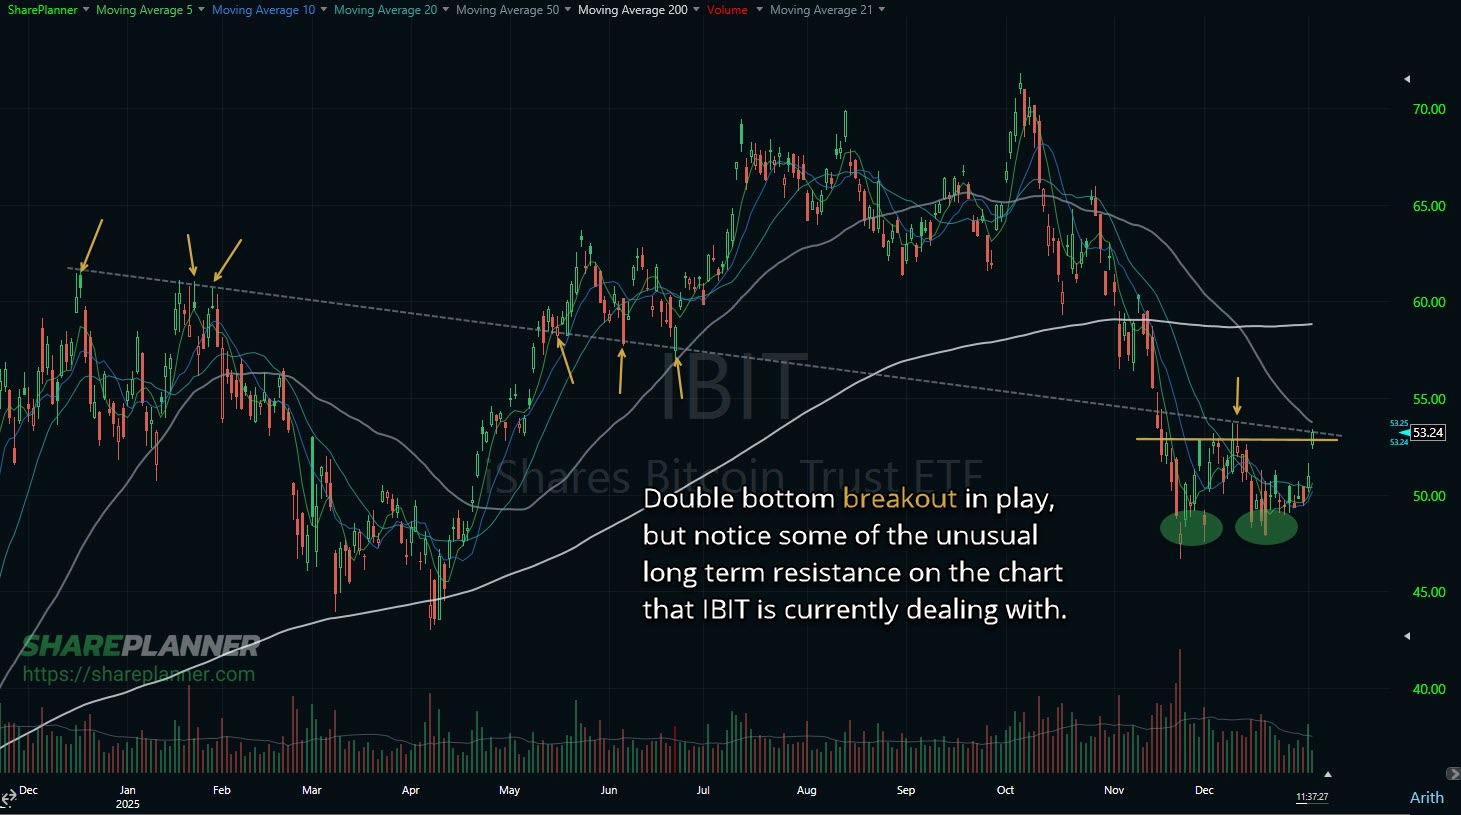
Double bottom breakout in play, but notice some of the unusual long term resistance on the chart that Bitcoin (IBIT) is currently dealing with.
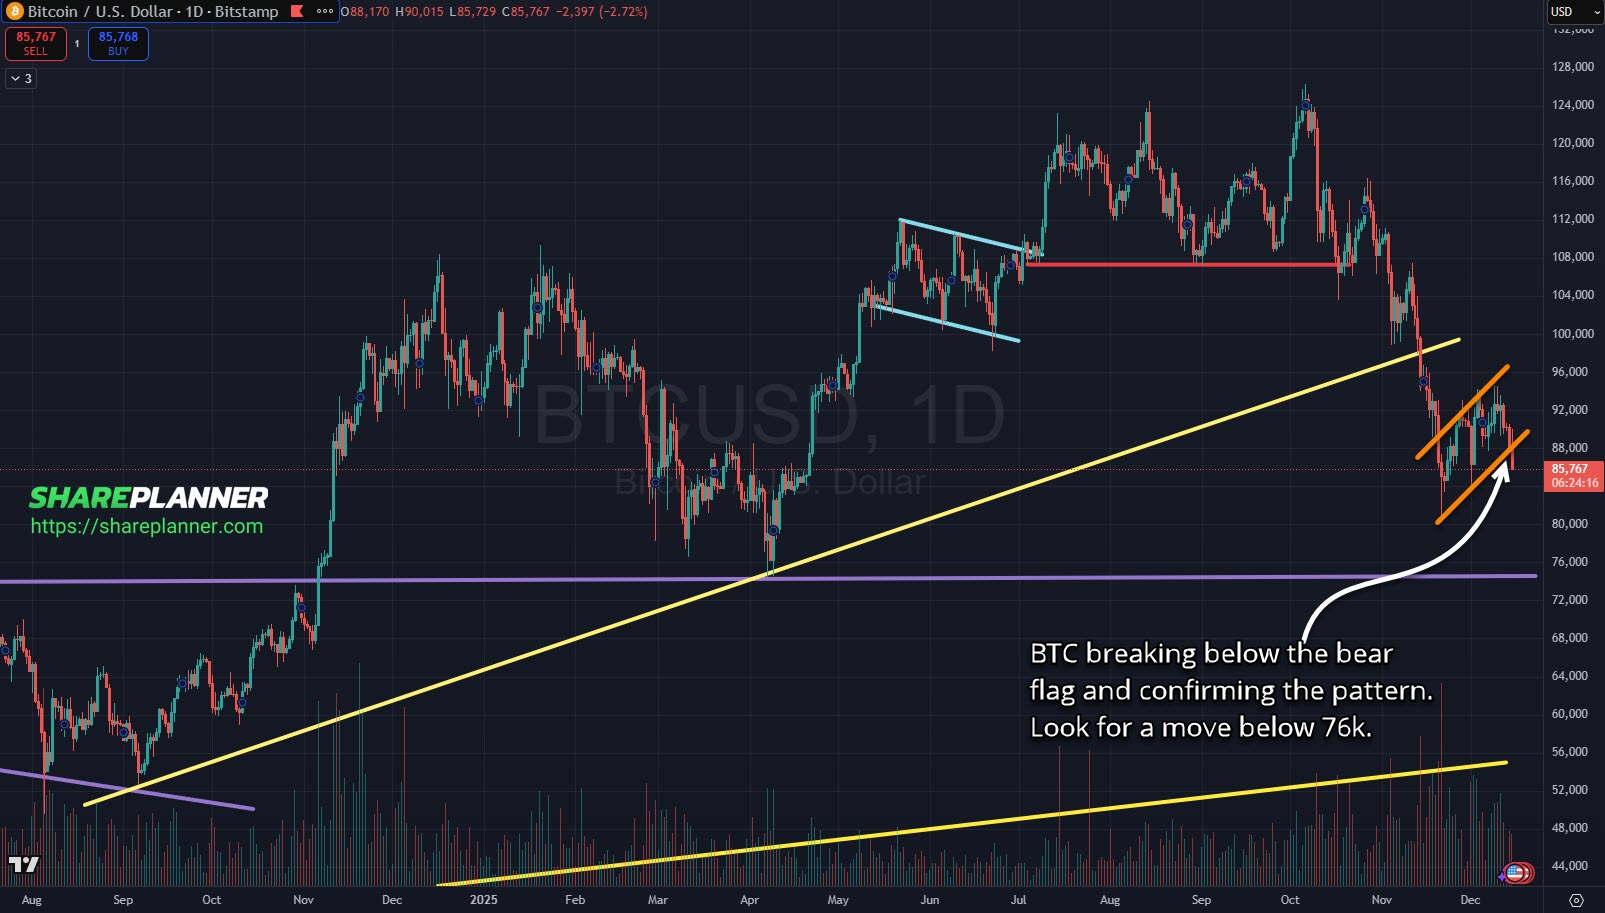
Bitcoin (BTC) confirming that bear flag pattern I've been talking about. Watch for a move into the 70's.

The Bitcoin ETF (IBIT), has had a tremendous run since its inception, but lately, it has started to show some signs of weakness. After hitting a high of $71.82, the stock has pulled back and is now trading around the $57/share mark. This pullback is significant, and it’s happening at a critical technical juncture that
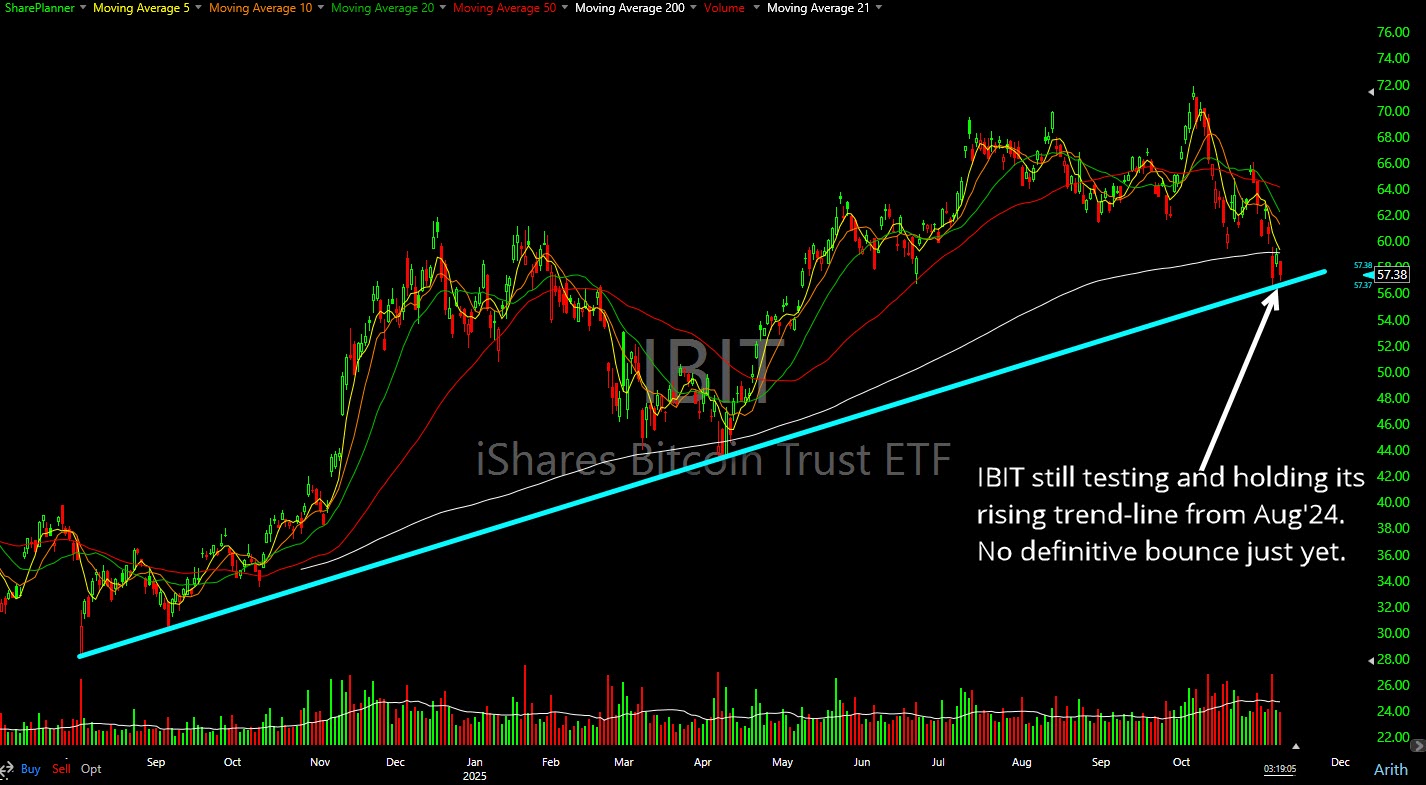
Pullback in the Bitcoin ETF (IBIT) continues to, so far, test and hold the rising trend-line, but yet to get a solid bounce out of it.
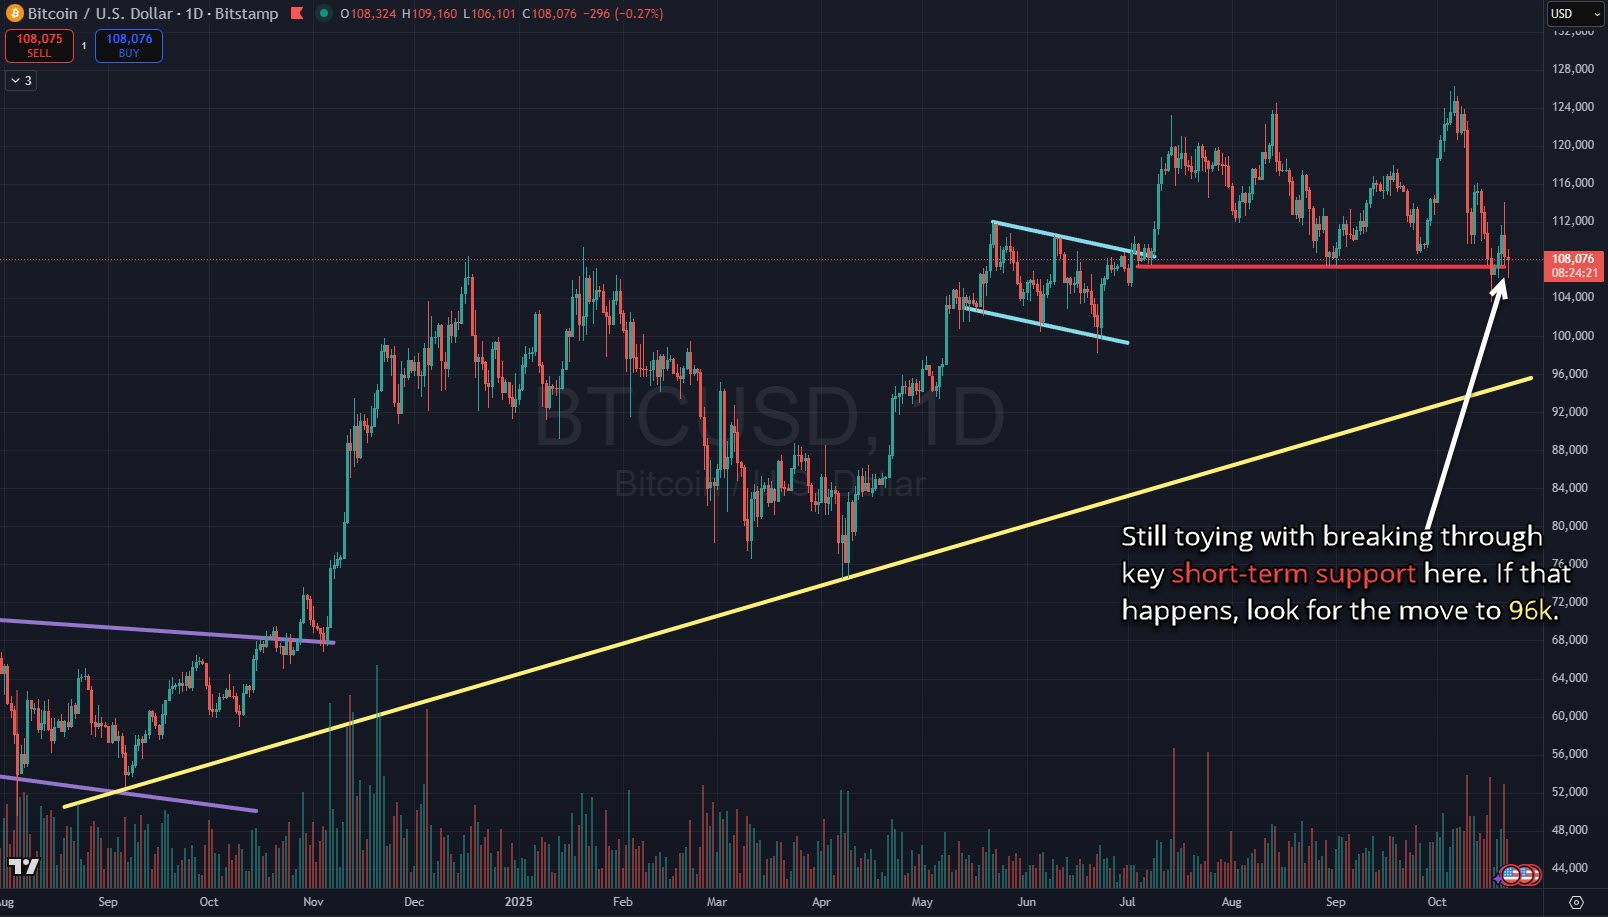
Bitcoin (BTC) very close here to a breakdown. If that happens, the next level is the rising trend-line at 96k.

Widening Divergence between Strategy (MSTR) and Bitcoin (BTC)
Episode Overview In today's episode, I talk about the merits of trading just one stock and the potential hazards it poses and why it leaves you looking for "a trade setup" rather than "the trade setup". ? Listen Now: Available on: Apple Podcasts | Spotify | Amazon | YouTube Episode Highlights & Timestamps [0:00] Should You Trade Just One Stock?Ryan opens the

Bitcoin hype finding its way into GameStop (GME) but that momentum may already be fading intraday.

spc@shareplanner.com
(904) 800-8420
© Copyright 2025 | SharePlanner Inc. All Rights Reserved.
Disclaimer: The information provided on this website is for educational and informational purposes only. Ryan Mallory and/or SharePlanner are not licensed financial advisors, brokers, or tax professionals. The content on this site should not be considered as financial, investment, tax, or legal advice.
All information and opinions expressed herein are based on sources believed to be accurate and reliable. However, we make no representation or warranty as to their accuracy, completeness, or reliability. Any action you take upon the information on this website is strictly at your own risk.
Past performance is not indicative of future results. Investing involves risk, including the possible loss of principal. All investors should make their own decisions based on their specific investment objectives and financial circumstances.
This site may contain links to external websites that are not provided or maintained by or in any way affiliated with Ryan Mallory and/or SharePlanner. Please note that Ryan Mallory and/or SharePlanner do not guarantee the accuracy, relevance, timeliness, or completeness of any information on these external websites.
By using this website, you agree that Ryan Mallory and/or SharePlanner and any affiliated parties are not responsible for any losses or damages resulting from your use of or reliance on the information provided.
It is strongly recommended that you consult with a qualified professional before making any financial decisions.