
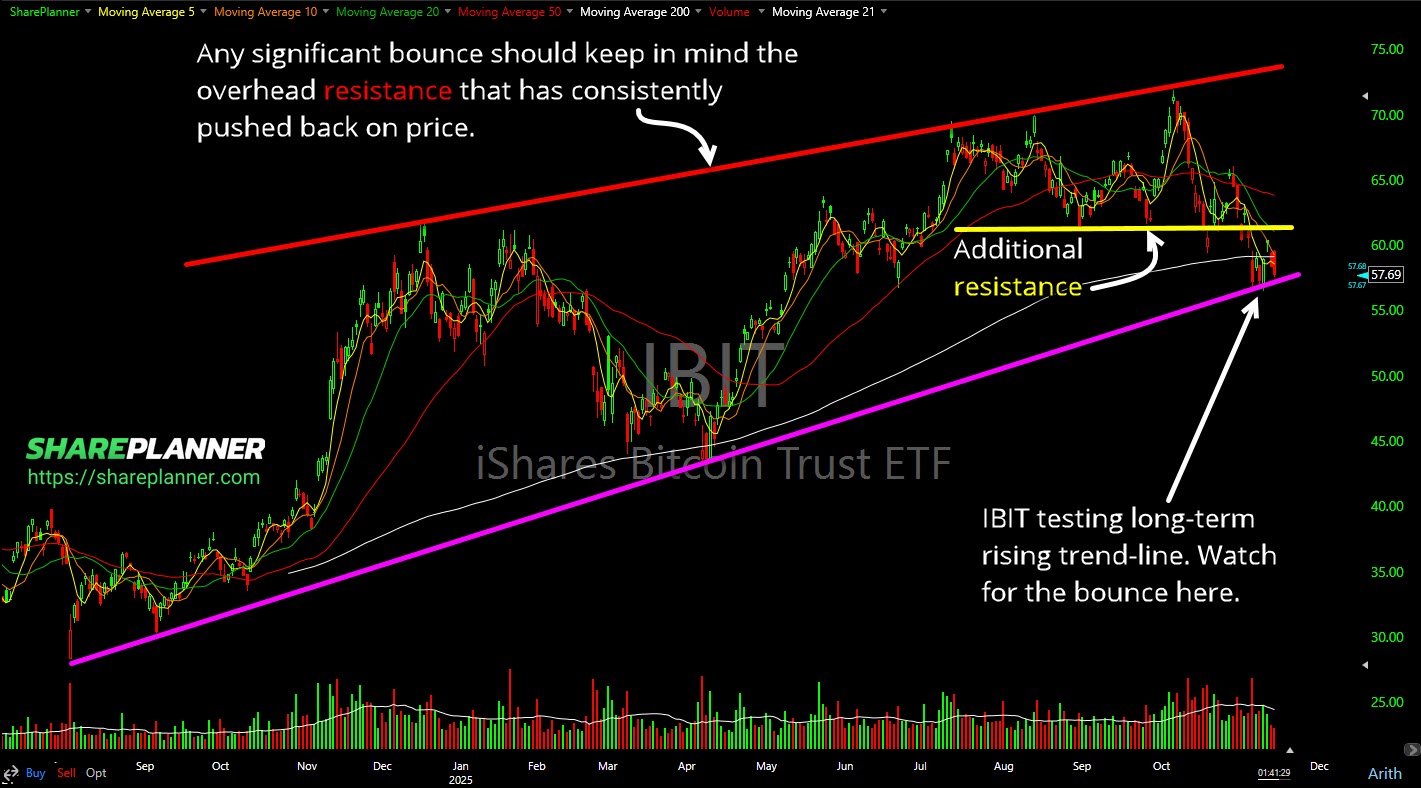
The Bitcoin ETF (IBIT), has had a tremendous run since its inception, but lately, it has started to show some signs of weakness. After hitting a high of $71.82, the stock has pulled back and is now trading around the $57/share mark. This pullback is significant, and it’s happening at a critical technical juncture that could have major implications for IBIT (and Bitcoin).
Let’s break down what the chart is telling us.
The Battle at Support for IBIT
Right now, IBIT is in a precarious position. It’s testing its rising trendline, which has provided support for the stock during its uptrend. A break below this trendline would be a bearish signal, suggesting that the upward momentum is fading.
At the same time, the stock is fighting to hold its 200-day moving average. For traders, the 200-day moving average is a key long-term indicator. It managed to hold it on the only other time it has been tested back in April of this year, and while it wasn’t a perfect test, it did ultimately hold. So holding this moving average would also be seen as a bullish gesture, while a sustained break below it is often a sign of a major trend change to the downside. The fact that both of these crucial support levels are being tested simultaneously makes this a critical moment for IBIT.
Potential Paths Forward
If IBIT manages to hold support here and bounce, the next challenge will be overhead resistance. A successful bounce would need to lead to a “higher high,” meaning it would have to eventually surpass the previous peak of $71.82 to confirm that the uptrend is still intact.
However, before we even get to that point, there’s a more immediate resistance level to watch. A resistance zone formed just above $61 (the yellow line on the chart). If IBIT rallies to this level but fails to break through, it would create a lower high. This price action would strongly suggest that a top is forming for IBIT, and by extension, for Bitcoin. A failure at this level would likely signal that the bears are taking control.

My Take on IBIT
Given the current setup, I’m watching these levels very closely. The confluence of the rising trendline and the 200-day moving average makes this a make-or-break spot. While a bounce is possible, the resistance at the $61 level presents a formidable obstacle.
For traders, don’t trade this and suddenly become complacent. Be vigilant, plan your trade and manage risk, and above all, don’t become a bagholder if the trade doesn’t go your way! A decisive break below the current support could open the door to a much deeper correction. Conversely, a strong bounce that reclaims key levels would be encouraging for the bulls. The price action in the coming days will be telling and could set the tone for the broader crypto market.
Become part of the Trading Block and get my trades, and learn how I manage them for consistent profits. With your subscription you will get my real-time trade setups via Discord and email, as well as become part of an incredibly helpful and knowledgeable community of traders to grow and learn with. If you’re not sure it is for you, don’t worry, because you get a Free 7-Day Trial. So Sign Up Today!


Welcome to Swing Trading the Stock Market Podcast!
I want you to become a better trader, and you know what? You absolutely can!
Commit these three rules to memory and to your trading:
#1: Manage the RISK ALWAYS!
#2: Keep the Losses Small
#3: Do #1 & #2 and the profits will take care of themselves.
That’s right, successful swing-trading is about managing the risk, and with Swing Trading the Stock Market podcast, I encourage you to email me (ryan@shareplanner.com) your questions, and there’s a good chance I’ll make a future podcast out of your stock market related question.
Passive investing can be a great source of funds for retirement and for building a nest egg. In this podcast episode, a husband and wife asks Ryan's thoughts on building a SPY position on just $2/day. While consistent building a nest egg, is great, the timing and strategy in doing so is just as important.
Be sure to check out my Swing-Trading offering through SharePlanner that goes hand-in-hand with my podcast, offering all of the research, charts and technical analysis on the stock market and individual stocks, not to mention my personal watch-lists, reviews and regular updates on the most popular stocks, including the all-important big tech stocks. Check it out now at: https://www.shareplanner.com/premium-plans
📈 START SWING-TRADING WITH ME! 📈
Click here to subscribe: https://shareplanner.com/tradingblock
— — — — — — — — —
💻 STOCK MARKET TRAINING COURSES 💻
Click here for all of my training courses: https://www.shareplanner.com/trading-academy
– The A-Z of the Self-Made Trader –https://www.shareplanner.com/the-a-z-of-the-self-made-trader
– The Winning Watch-List — https://www.shareplanner.com/winning-watchlist
– Patterns to Profits — https://www.shareplanner.com/patterns-to-profits
– Get 1-on-1 Coaching — https://www.shareplanner.com/coaching
— — — — — — — — —
❤️ SUBSCRIBE TO MY YOUTUBE CHANNEL 📺
Click here to subscribe: https://www.youtube.com/shareplanner?sub_confirmation=1
🎧 LISTEN TO MY PODCAST 🎵
Click here to listen to my podcast: https://open.spotify.com/show/5Nn7MhTB9HJSyQ0C6bMKXI
— — — — — — — — —
💰 FREE RESOURCES 💰
— — — — — — — — —
🛠 TOOLS OF THE TRADE 🛠
Software I use (TC2000): https://bit.ly/2HBdnBm
— — — — — — — — —
📱 FOLLOW SHAREPLANNER ON SOCIAL MEDIA 📱
*Disclaimer: Ryan Mallory is not a financial adviser and this podcast is for entertainment purposes only. Consult your financial adviser before making any decisions.
You Might Like

How to Trade Breakouts Without Getting Trapped

Managing Headline Risk: How to Survive the News Cycle Without Losing Your Mind

What to Do After a Winning Trade