
Market finally pulled back after the the $SPX reached it’s 23.6% Fibonacci retracement level. I did posted this chart on my $SPY read on January 29 2013. But I am to re post the current chart so you all can see how important these levels are and why they can help you time into going in or out of positions.
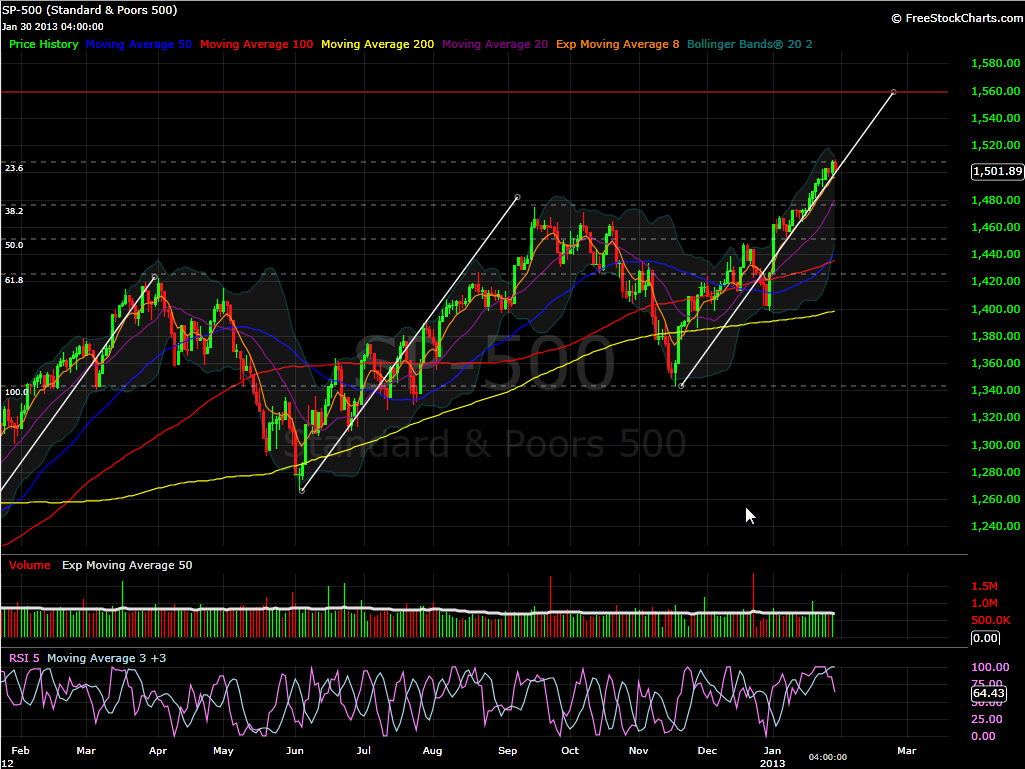
So now what will happen? Well my expectation is that we will now start a 2 to 3 weeks pullback and test the 1476.32 level in the $SPX. On the $SPY that represents the 148.25 level. One other good piece of information is that the $NYMO dropped to a neutral position and not only it gives us traders an indication that we now have more than enough space to break to new highs, but also the space necessary for us to believe that a 2.5 to 3% pullback is now enough to calm everyone else before the next big leg up.
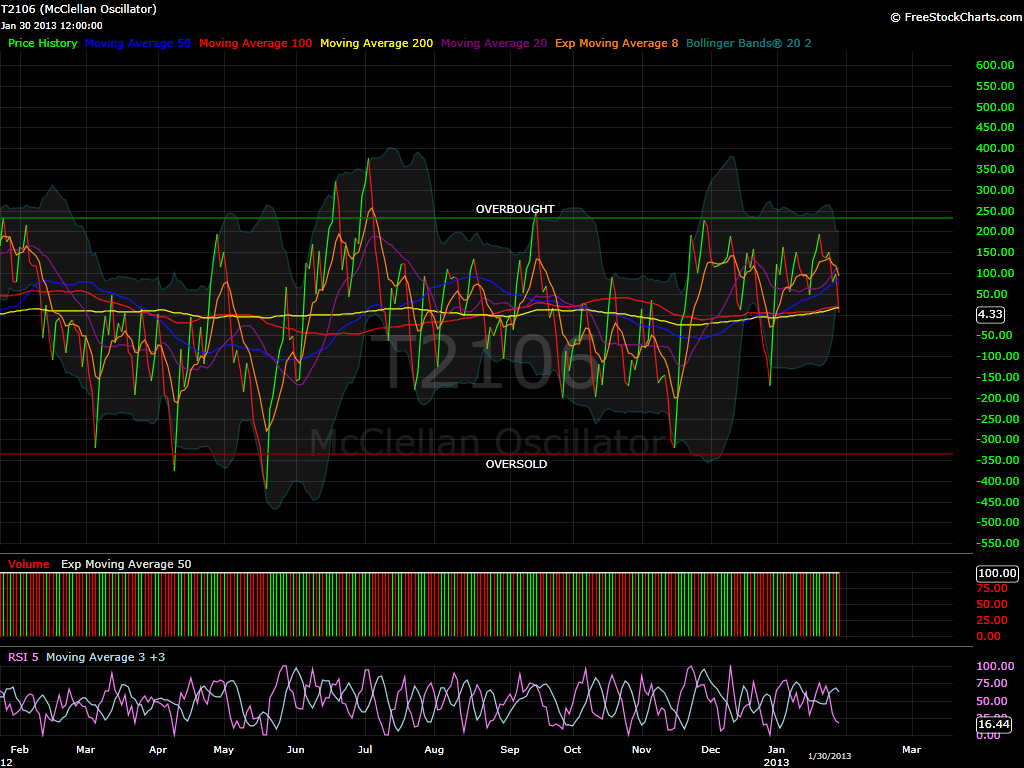
My current expectation is for us to start seeing some failed break outs, and dips will only get bought by retail investors, who will have to endure losses.
Now here is the other side of the trade. If for some miraculous reason we can push ourselves over that 1508.00 Fibonacci Level on the $SPX, then all that I just wrote is garbage. But the chances of this happening are quite small to be honest.
With no more to say, I will leave you with the current levels for the day.
$SPY 1st support is 148.93, 2nd support 148.48 and 3rd is 147.96.
$SPY 1st target is 150.42, 2nd is 150.98, 3rd is 151.32, and 4th one just for fun is 151.83.
Trade what you see not what you think.


Welcome to Swing Trading the Stock Market Podcast!
I want you to become a better trader, and you know what? You absolutely can!
Commit these three rules to memory and to your trading:
#1: Manage the RISK ALWAYS!
#2: Keep the Losses Small
#3: Do #1 & #2 and the profits will take care of themselves.
That’s right, successful swing-trading is about managing the risk, and with Swing Trading the Stock Market podcast, I encourage you to email me (ryan@shareplanner.com) your questions, and there’s a good chance I’ll make a future podcast out of your stock market related question.
Watching the dollars rise and fall in your trading account can turn a well-planned swing trade into an emotional, deeply personal decision. In this episode, I explain why focusing on price action, percentage returns, and R-multiples can help you avoid cutting winners early, holding losers too long, and abandoning your trading plan.
Be sure to check out my Swing-Trading offering through SharePlanner that goes hand-in-hand with my podcast, offering all of the research, charts and technical analysis on the stock market and individual stocks, not to mention my personal watch-lists, reviews and regular updates on the most popular stocks, including the all-important big tech stocks. Check it out now at: https://www.shareplanner.com/premium-plans
📈 START SWING-TRADING WITH ME! 📈
Click here to subscribe: https://shareplanner.com/tradingblock
— — — — — — — — —
💻 STOCK MARKET TRAINING COURSES 💻
Click here for all of my training courses: https://www.shareplanner.com/trading-academy
– The A-Z of the Self-Made Trader –https://www.shareplanner.com/the-a-z-of-the-self-made-trader
– The Winning Watch-List — https://www.shareplanner.com/winning-watchlist
– Patterns to Profits — https://www.shareplanner.com/patterns-to-profits
– Get 1-on-1 Coaching — https://www.shareplanner.com/coaching
— — — — — — — — —
❤️ SUBSCRIBE TO MY YOUTUBE CHANNEL 📺
Click here to subscribe: https://www.youtube.com/shareplanner?sub_confirmation=1
🎧 LISTEN TO MY PODCAST 🎵
Click here to listen to my podcast: https://open.spotify.com/show/5Nn7MhTB9HJSyQ0C6bMKXI
— — — — — — — — —
💰 FREE RESOURCES 💰
— — — — — — — — —
🛠 TOOLS OF THE TRADE 🛠
Software I use (TC2000): https://bit.ly/2HBdnBm
— — — — — — — — —
📱 FOLLOW SHAREPLANNER ON SOCIAL MEDIA 📱
*Disclaimer: Ryan Mallory is not a financial adviser and this podcast is for entertainment purposes only. Consult your financial adviser before making any decisions.
You Might Like

South Korea: The Hidden Driver of US Tech Volatility
Stop Trying to Hit Home Runs: Start Trading Within Your Means
How to Trade Breakouts Without Getting Trapped