
$BBRY Daily Chart – Watch for the 15.50 level. It could take off from there or find some decent resistance.
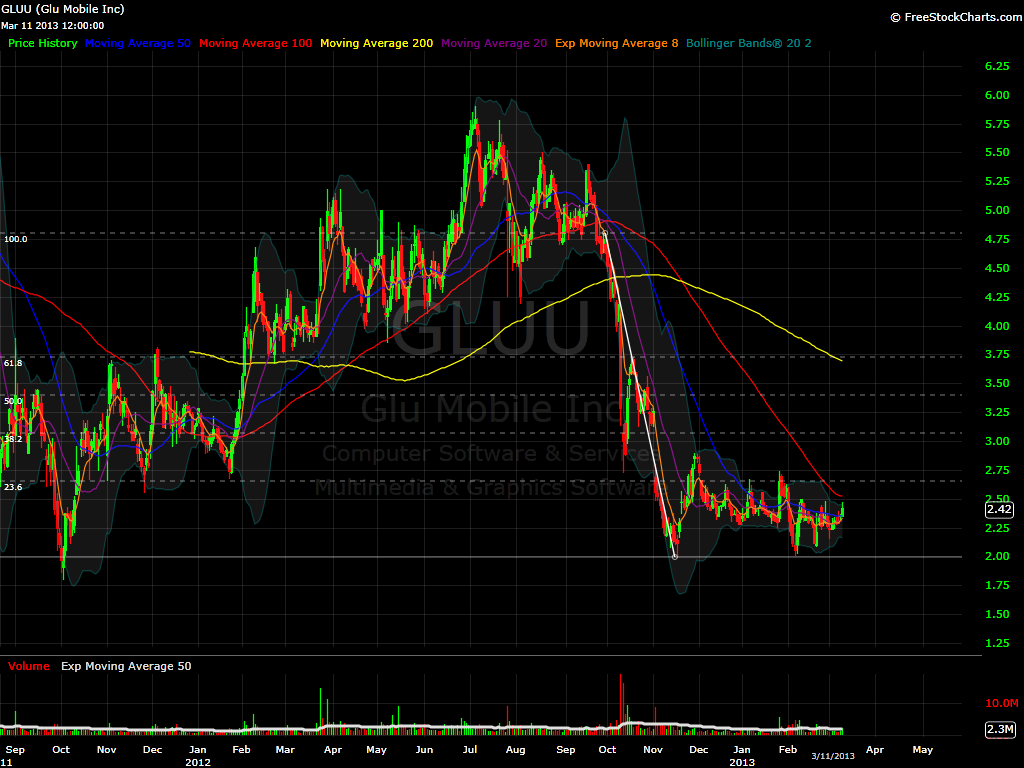
$GLUU Daily Chart – Gaping nicely, I will be watching the 3.07 level, if it breaks, then this one can continue to explode.
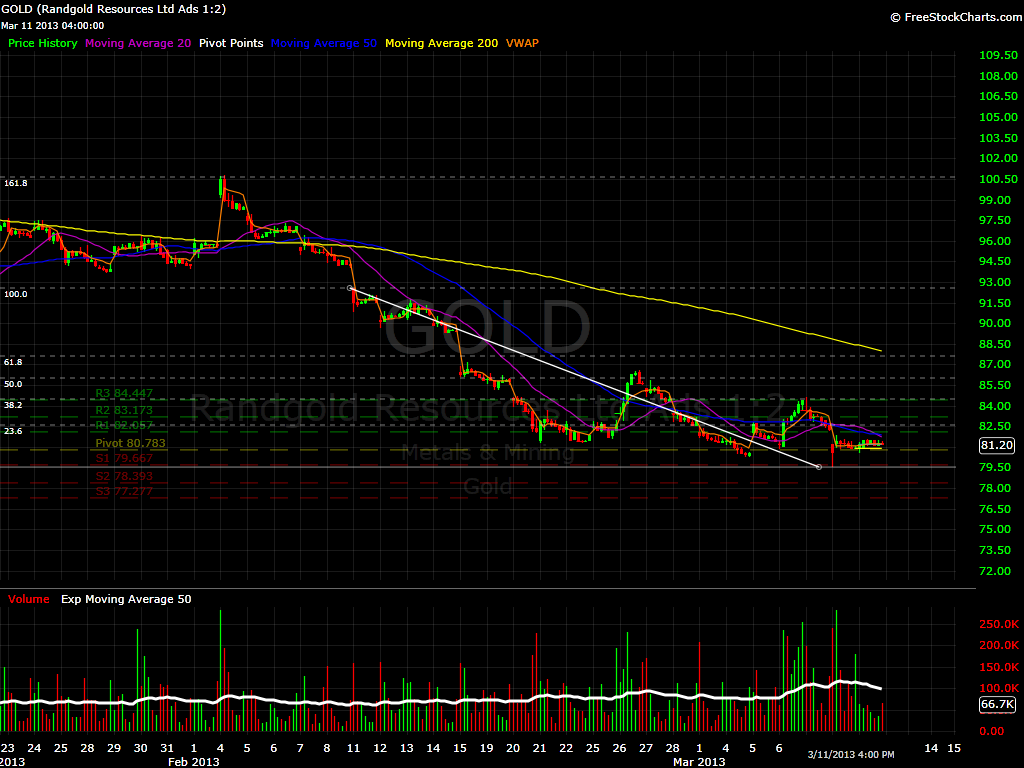
$GOLD Hourly Chart – 82.60 is where things really start to happen, specially if the market cannot hold this uptrend.
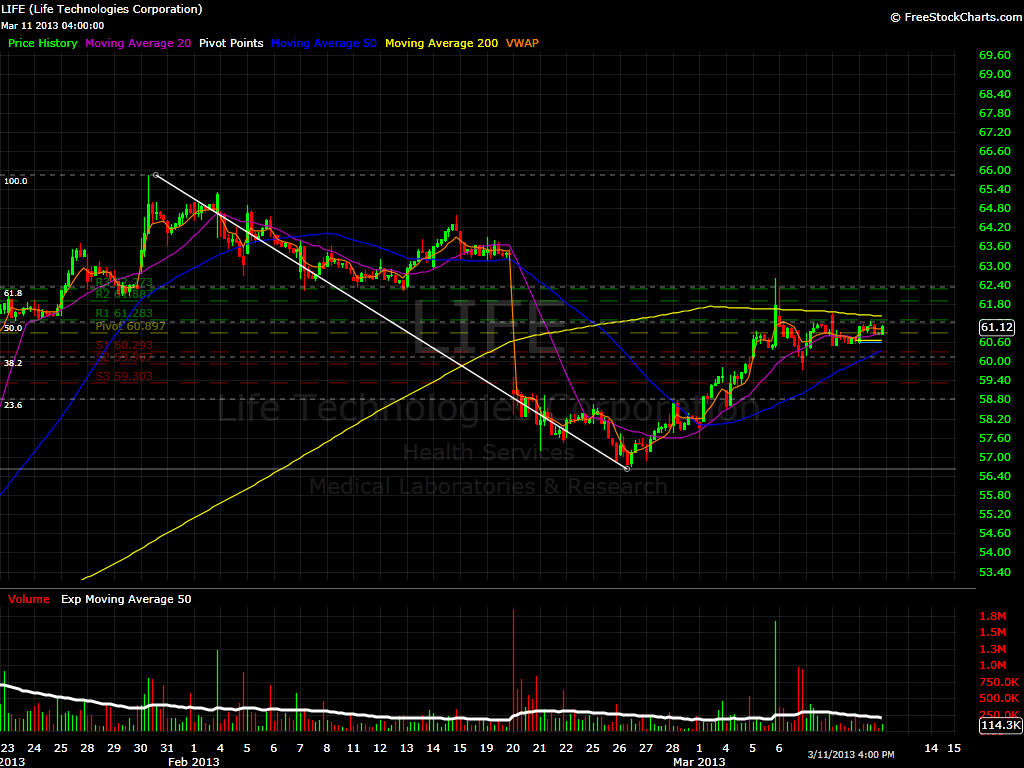
$LIFE Hourly Chart – Gaping above the 61.8% Fibonmacci Level. I am not sure this pop is legit, so I am considering shorting it under 62.33. Considering does not mean I will do it by the way. This is not an easy chart, but I decided to post it for educational purposes.
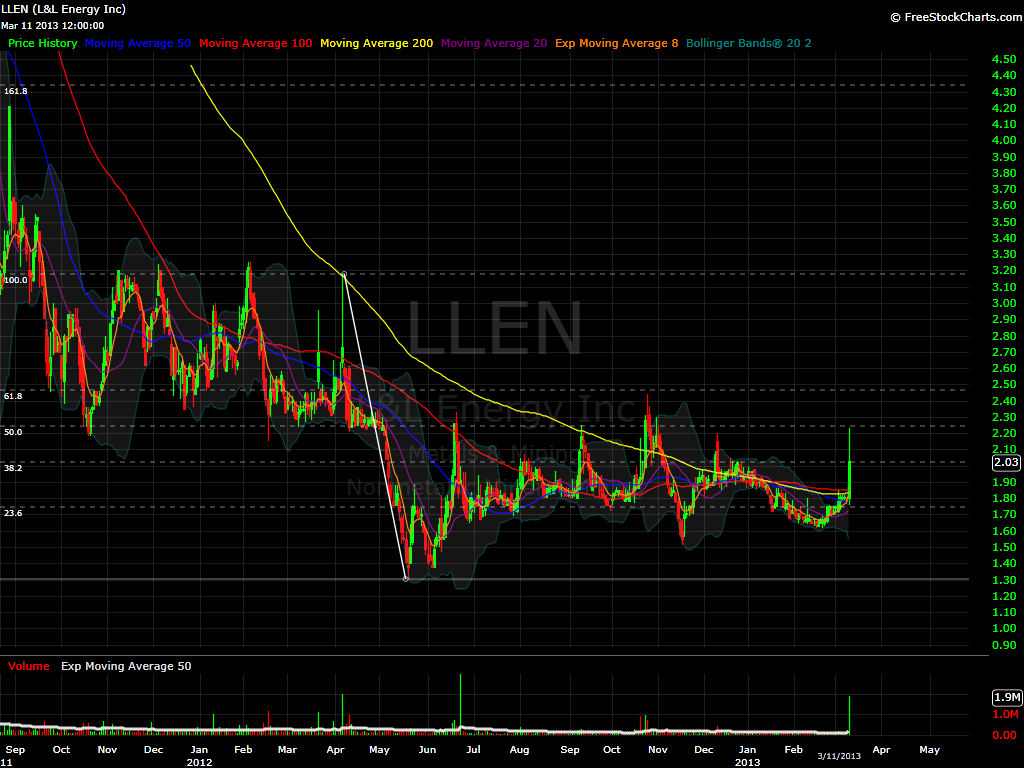
$LLEN Daily Chart – If it crosses 2.24, and hold above it. Then 2.46 should be it’s 1st target.
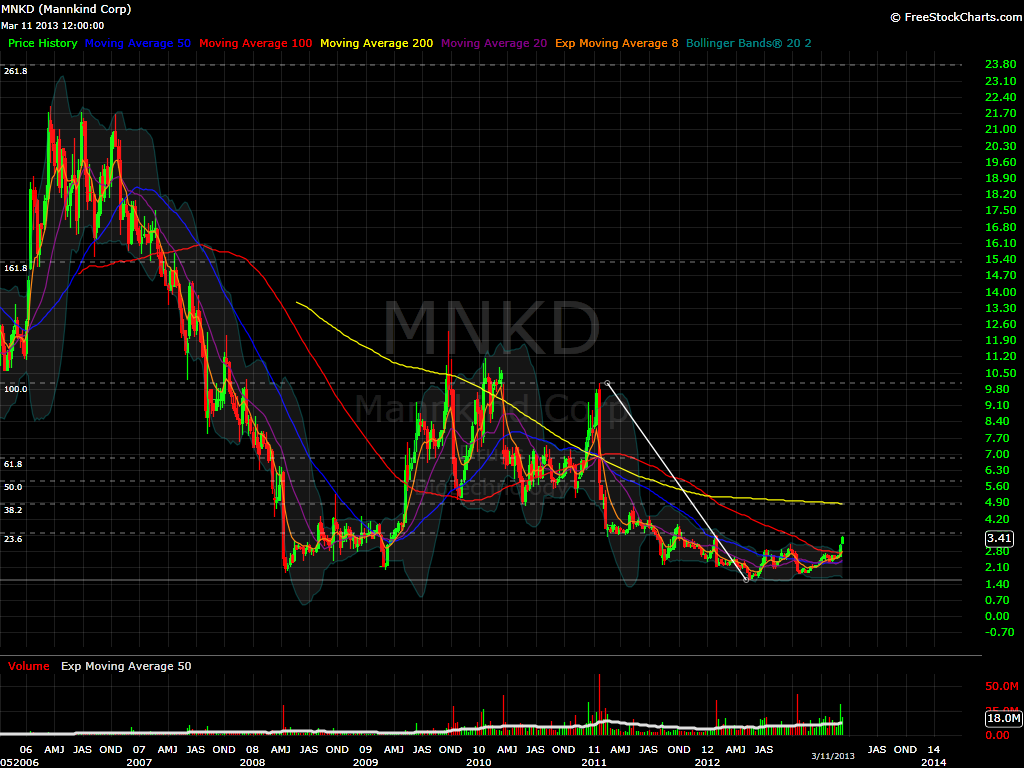
$MNKD Weekly Chart. 3.57 is the launch pad nothing else to say it, and it better not fail it.
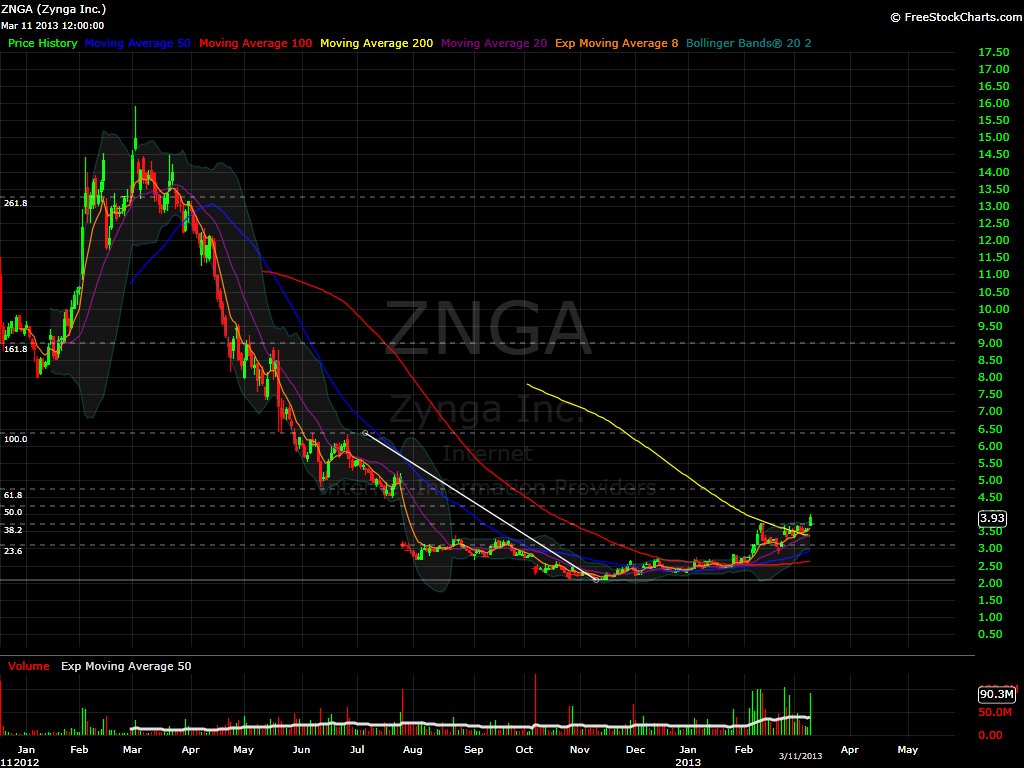
$ZNGA Daily Chart – I personally don’t like where it is opening, I wish it would open above the 4.23 fib level, but I would like to see it drop, hold the 38.2% Fibonacci level at 3.72, and then take off again.


Welcome to Swing Trading the Stock Market Podcast!
I want you to become a better trader, and you know what? You absolutely can!
Commit these three rules to memory and to your trading:
#1: Manage the RISK ALWAYS!
#2: Keep the Losses Small
#3: Do #1 & #2 and the profits will take care of themselves.
That’s right, successful swing-trading is about managing the risk, and with Swing Trading the Stock Market podcast, I encourage you to email me (ryan@shareplanner.com) your questions, and there’s a good chance I’ll make a future podcast out of your stock market related question.
As swing traders, we have to accept that losing will be a regular part of trading and one that we must accept. In this podcast episode, Ryan explains how a trader who isn't comfortable with losing is a losing trader. If you're not comfortable with losing in the stock market, you'll never find real success as a trader either.
Be sure to check out my Swing-Trading offering through SharePlanner that goes hand-in-hand with my podcast, offering all of the research, charts and technical analysis on the stock market and individual stocks, not to mention my personal watch-lists, reviews and regular updates on the most popular stocks, including the all-important big tech stocks. Check it out now at: https://www.shareplanner.com/premium-plans
📈 START SWING-TRADING WITH ME! 📈
Click here to subscribe: https://shareplanner.com/tradingblock
— — — — — — — — —
💻 STOCK MARKET TRAINING COURSES 💻
Click here for all of my training courses: https://www.shareplanner.com/trading-academy
– The A-Z of the Self-Made Trader –https://www.shareplanner.com/the-a-z-of-the-self-made-trader
– The Winning Watch-List — https://www.shareplanner.com/winning-watchlist
– Patterns to Profits — https://www.shareplanner.com/patterns-to-profits
– Get 1-on-1 Coaching — https://www.shareplanner.com/coaching
— — — — — — — — —
❤️ SUBSCRIBE TO MY YOUTUBE CHANNEL 📺
Click here to subscribe: https://www.youtube.com/shareplanner?sub_confirmation=1
🎧 LISTEN TO MY PODCAST 🎵
Click here to listen to my podcast: https://open.spotify.com/show/5Nn7MhTB9HJSyQ0C6bMKXI
— — — — — — — — —
💰 FREE RESOURCES 💰
— — — — — — — — —
🛠 TOOLS OF THE TRADE 🛠
Software I use (TC2000): https://bit.ly/2HBdnBm
— — — — — — — — —
📱 FOLLOW SHAREPLANNER ON SOCIAL MEDIA 📱
*Disclaimer: Ryan Mallory is not a financial adviser and this podcast is for entertainment purposes only. Consult your financial adviser before making any decisions.
You Might Like

Building Your Trading Strategy for Lasting Success

Resistance At Broken Trend Lines

The Retail Trading Revolution: How Small Investors Are Reshaping the Stock Market