

Broken trend lines creates resistance
Something you want to watch for is the resistance that forms when a stock breaks below its trend-line. For most traders, once a trend line is broken, the trader simply dismisses the trend-line and forgets it never existed.
However to the contrary, broken trend-lines creates a new layer of resistance.
Check out the Roblox (RBLX) chart below, and notice how when the stock gapped below the trendline on August 15th, on news that there were lawsuits filed against it over child safety concerns. It found support at the 50-day moving average (red line) and quickly bounced back. Then it tested the old trendline, closed just below it (orange line) and then saw a sharp rejection the following day.
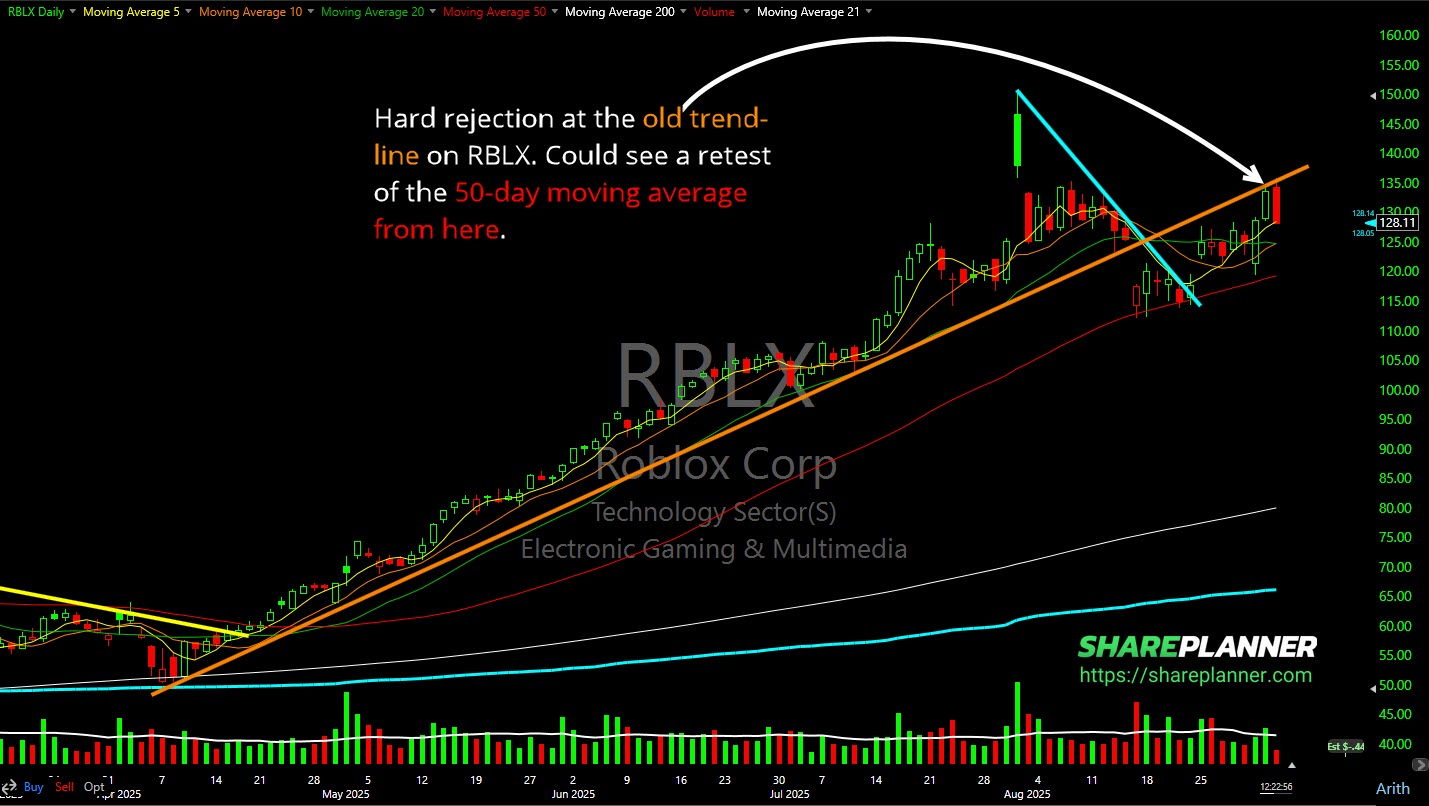
That is the power of broken trend-lines and how they can become significant levels of resistance.
Now, not all is lost when broken trend lines becomes resistance, in fact, it can still march higher even still. Two scenarios can still play out: 1) the stock eventually recaptures the broken trend line, and all is merry again, or 2) it rides the under side of the broken trend-line higher. The latter caps the stock’s potential gains, but still it manages to creep higher.

The third scenario is what you really have to watch out for and that is where there is a hard rejection like what you are seeing here starting on RBLX. That should be a huge red flag for any trader, if they see that unfold.
Obviously, not all trend lines are the same, and some are steeper than the others. If a particular broken trend-line has an extremely steep slope to it, I won’t pay it much attention because it will be difficult to test, unless there is a monumental move out of the stock, and if there is such a move, well, that is a welcomed development.
But it is the broken trend-lines that have been tested in the past on multiple occasions as previous support (and not just twice) that you want to watch out for as it pertains to price rejection at when the trend-line does break.
Final thoughts on broken trend lines becoming resistance
A lot of it comes down to managing the risk and planning your trade:
- What does the reward/risk look like on a retest of that broken trend-line?
- If there is a rejection, will you be able to salvage the trade for a decent gain still?
- And finally, is the trend-line so steep that it is unlikely to be tested down the road.
Remember too, that broken trend-lines coupled with other areas of resistance can make such areas even more challenging to break through, so if you see that on the charts, you’ll want to be even more care with the resistance and the trade that you are looking at taking or already in.
Become part of the Trading Block and get my trades, and learn how I manage them for consistent profits. With your subscription you will get my real-time trade setups via Discord and email, as well as become part of an incredibly helpful and knowledgeable community of traders to grow and learn with. If you’re not sure it is for you, don’t worry, because you get a Free 7-Day Trial. So Sign Up Today!


Welcome to Swing Trading the Stock Market Podcast!
I want you to become a better trader, and you know what? You absolutely can!
Commit these three rules to memory and to your trading:
#1: Manage the RISK ALWAYS!
#2: Keep the Losses Small
#3: Do #1 & #2 and the profits will take care of themselves.
That’s right, successful swing-trading is about managing the risk, and with Swing Trading the Stock Market podcast, I encourage you to email me (ryan@shareplanner.com) your questions, and there’s a good chance I’ll make a future podcast out of your stock market related question.
Passive investing can be a great source of funds for retirement and for building a nest egg. In this podcast episode, a husband and wife asks Ryan's thoughts on building a SPY position on just $2/day. While consistent building a nest egg, is great, the timing and strategy in doing so is just as important.
Be sure to check out my Swing-Trading offering through SharePlanner that goes hand-in-hand with my podcast, offering all of the research, charts and technical analysis on the stock market and individual stocks, not to mention my personal watch-lists, reviews and regular updates on the most popular stocks, including the all-important big tech stocks. Check it out now at: https://www.shareplanner.com/premium-plans
📈 START SWING-TRADING WITH ME! 📈
Click here to subscribe: https://shareplanner.com/tradingblock
— — — — — — — — —
💻 STOCK MARKET TRAINING COURSES 💻
Click here for all of my training courses: https://www.shareplanner.com/trading-academy
– The A-Z of the Self-Made Trader –https://www.shareplanner.com/the-a-z-of-the-self-made-trader
– The Winning Watch-List — https://www.shareplanner.com/winning-watchlist
– Patterns to Profits — https://www.shareplanner.com/patterns-to-profits
– Get 1-on-1 Coaching — https://www.shareplanner.com/coaching
— — — — — — — — —
❤️ SUBSCRIBE TO MY YOUTUBE CHANNEL 📺
Click here to subscribe: https://www.youtube.com/shareplanner?sub_confirmation=1
🎧 LISTEN TO MY PODCAST 🎵
Click here to listen to my podcast: https://open.spotify.com/show/5Nn7MhTB9HJSyQ0C6bMKXI
— — — — — — — — —
💰 FREE RESOURCES 💰
— — — — — — — — —
🛠 TOOLS OF THE TRADE 🛠
Software I use (TC2000): https://bit.ly/2HBdnBm
— — — — — — — — —
📱 FOLLOW SHAREPLANNER ON SOCIAL MEDIA 📱
*Disclaimer: Ryan Mallory is not a financial adviser and this podcast is for entertainment purposes only. Consult your financial adviser before making any decisions.
You Might Like

Stop Trying to Hit Home Runs: Start Trading Within Your Means

How to Trade Breakouts Without Getting Trapped

Managing Headline Risk: How to Survive the News Cycle Without Losing Your Mind