
$BIG with heavy resistance overhead with price level and trend-line resistance.
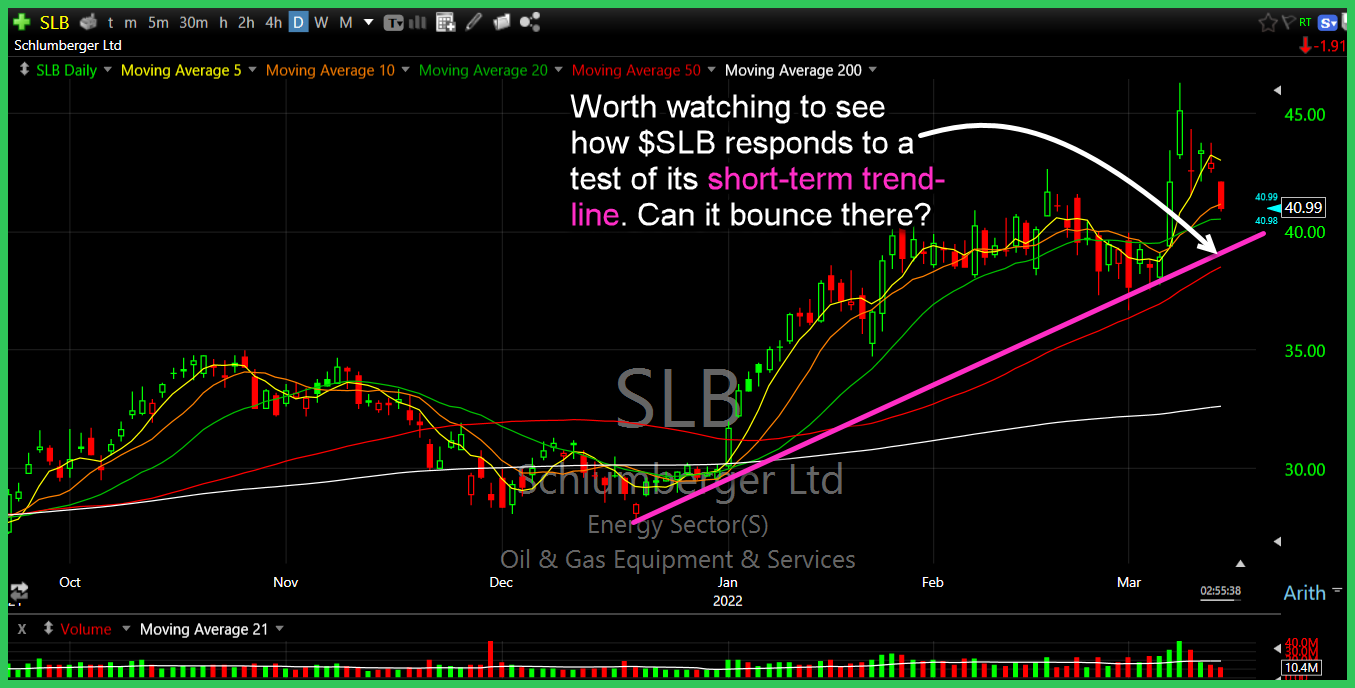
Worth watching to see how $SLB responds to a test of its short-term trend-line. Can it bounce there?

$URI facing stiff overhead resistance.
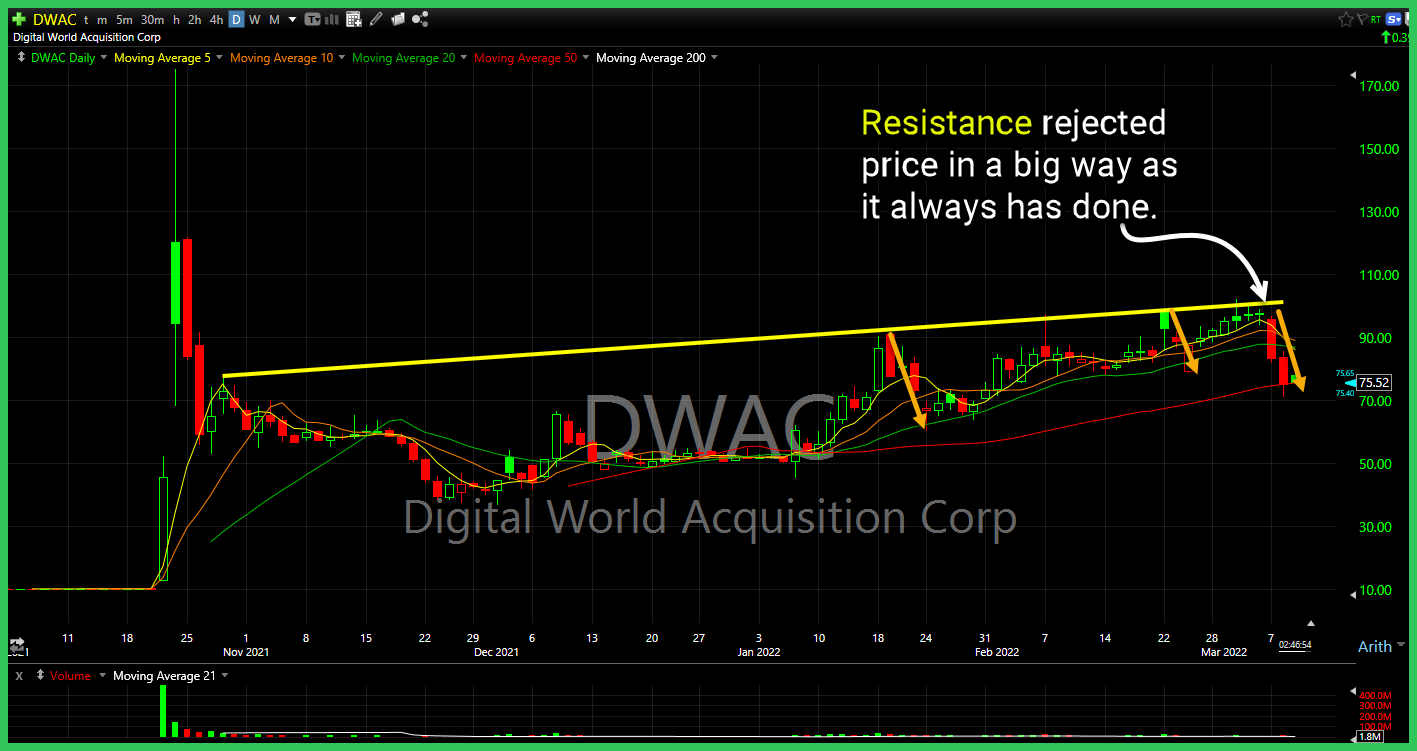
For the better part of a month, I've been saying that Digital World Acquisition (DWAC) is a problem chart as long as it stays below major resistance. Crude Oil Futures (CL) pulling back to its long-term support level at $109-110 Home Depot (HD) declining trend-line weighing on price. Can't get bullish on the
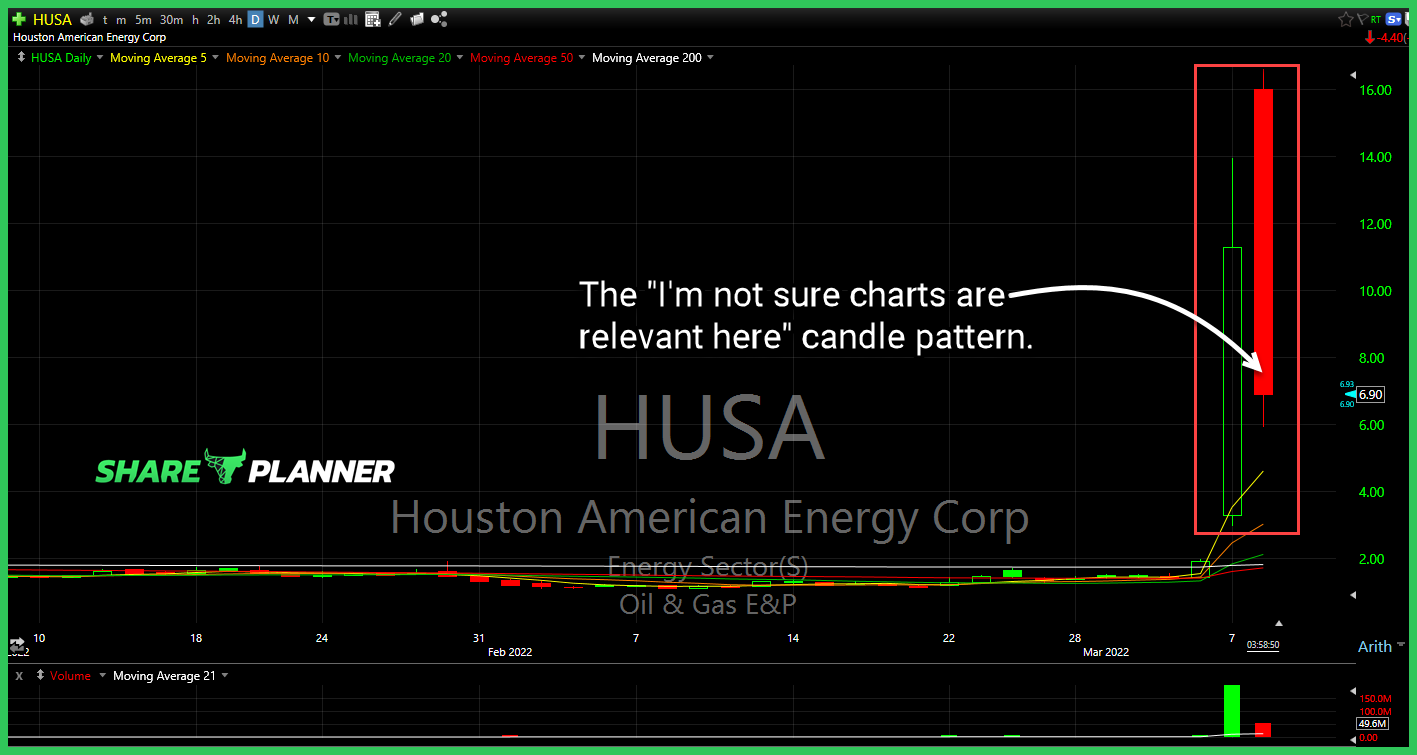
This is certainly one of my favorites: the “I’m not sure charts are relevant here” candle pattern.
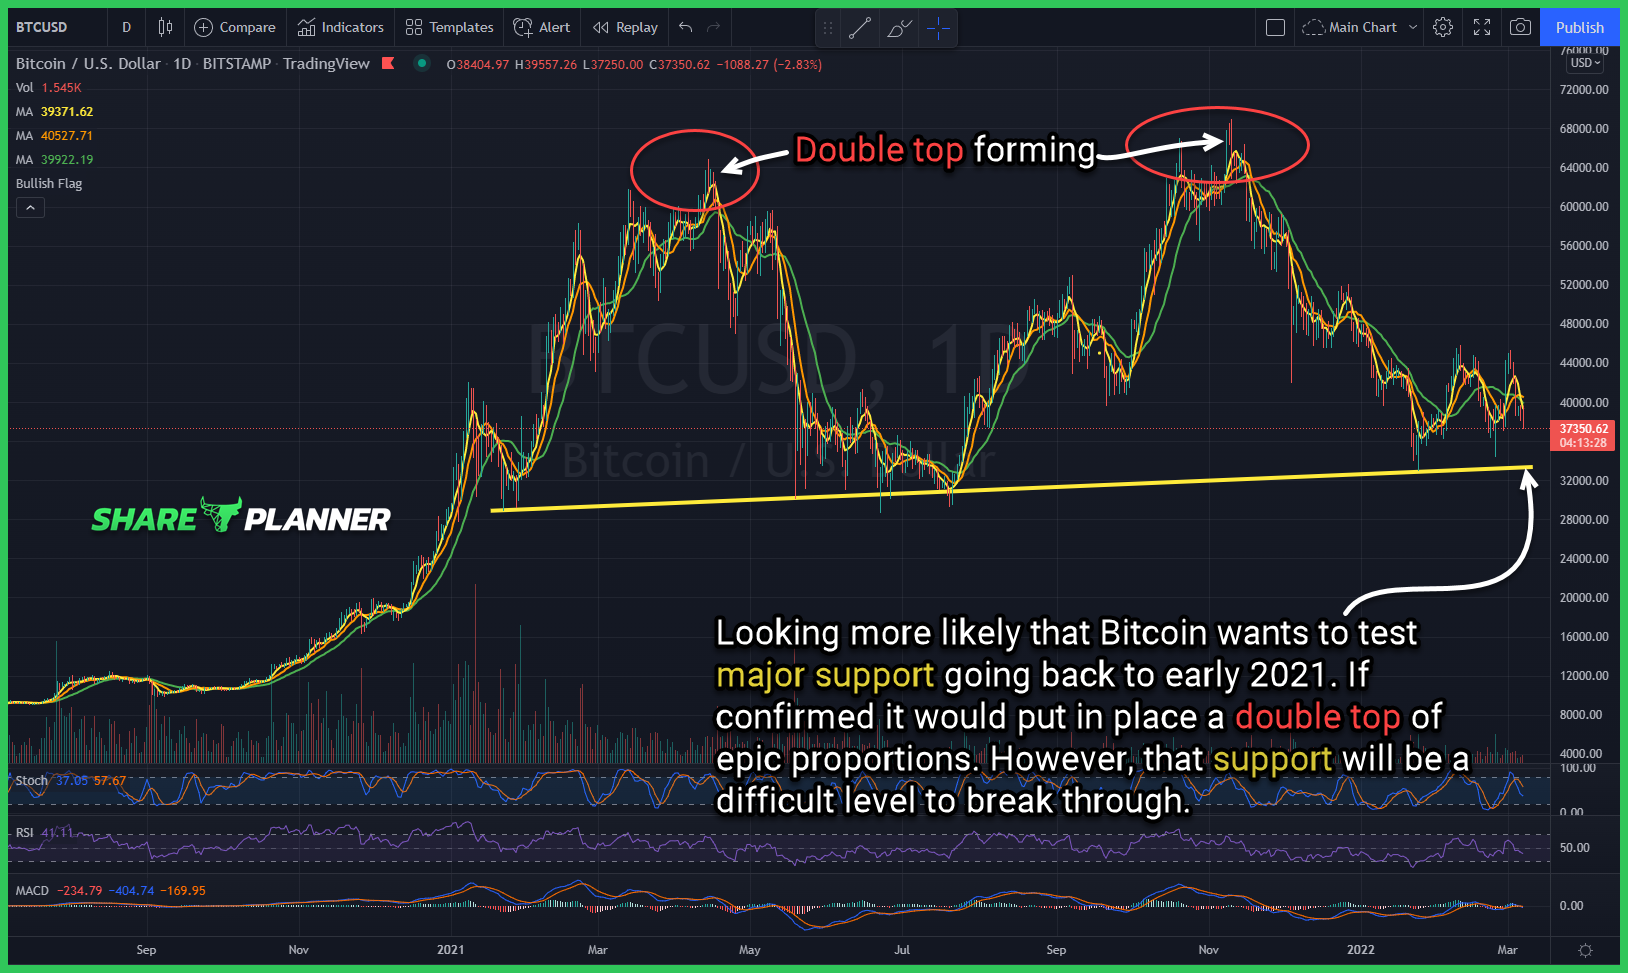
$BTC.X Bitcoin double top forming, though it will be a difficult one to confirm.
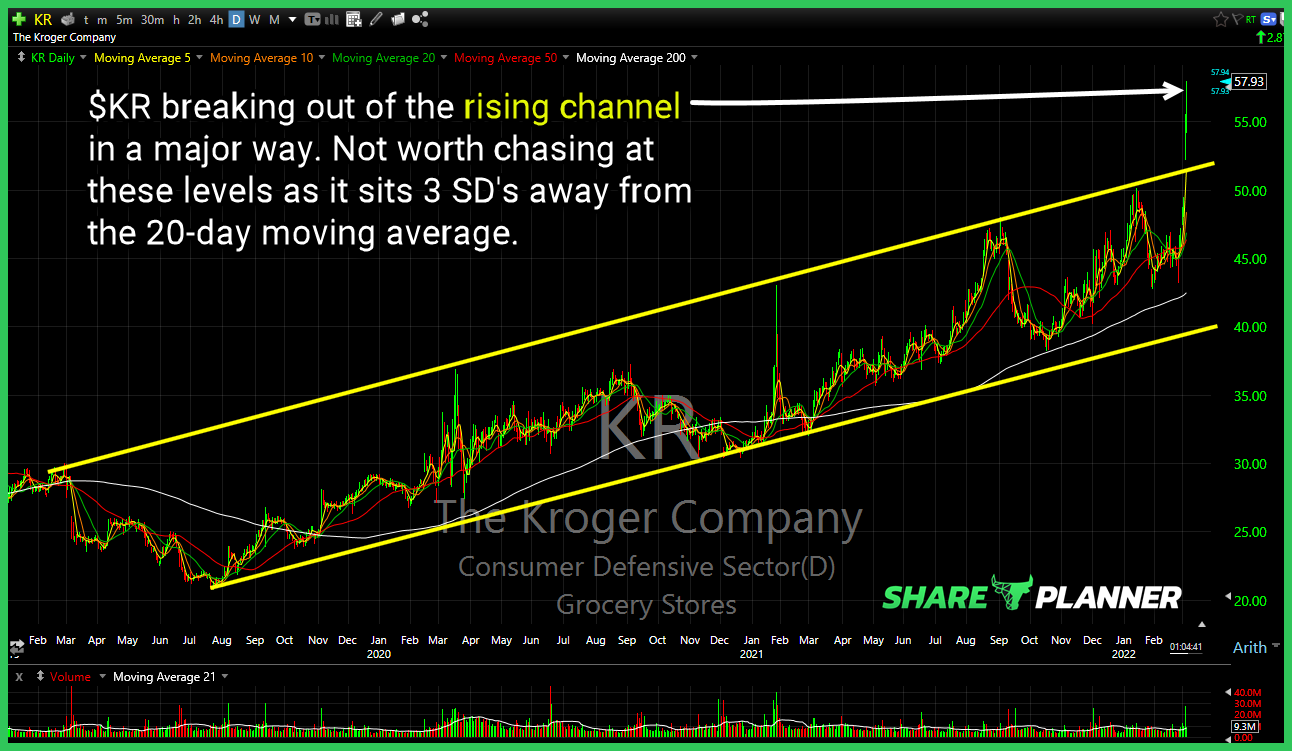
$KR rally – is this a product of them increasing earnings, revenue, or both? If the former, then they are capitalizing on inflation rather than adjusting to inflation, right? Perhaps more are eating at home and less eating out?

$NIO testing critical support. If it can hold there is the potential for a triple bottom, but if it doesn’t, there’s little support underneath.
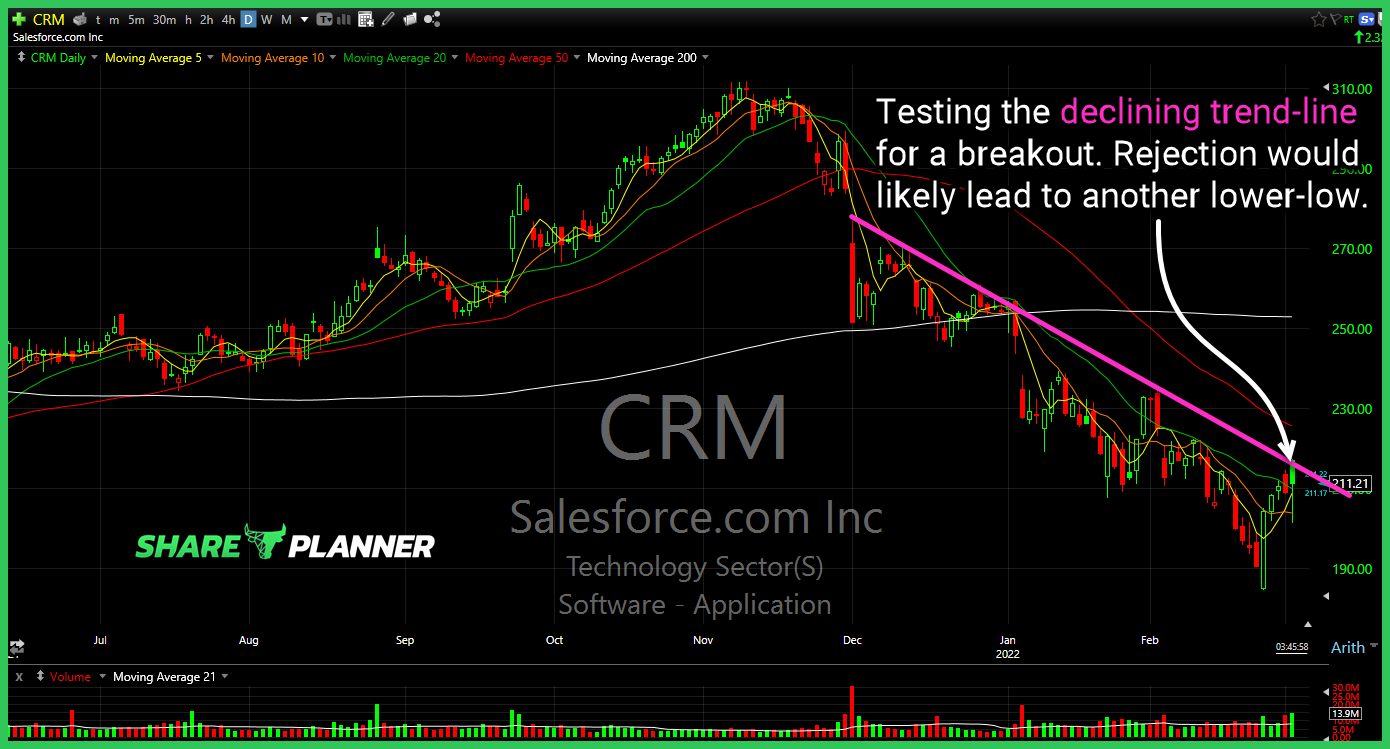
$CRM with a declining trend-line in play. $UPST looks impressive here with that basing pattern and inverse head and shoulders pattern. $AFL bouncing at two significant levels of support.
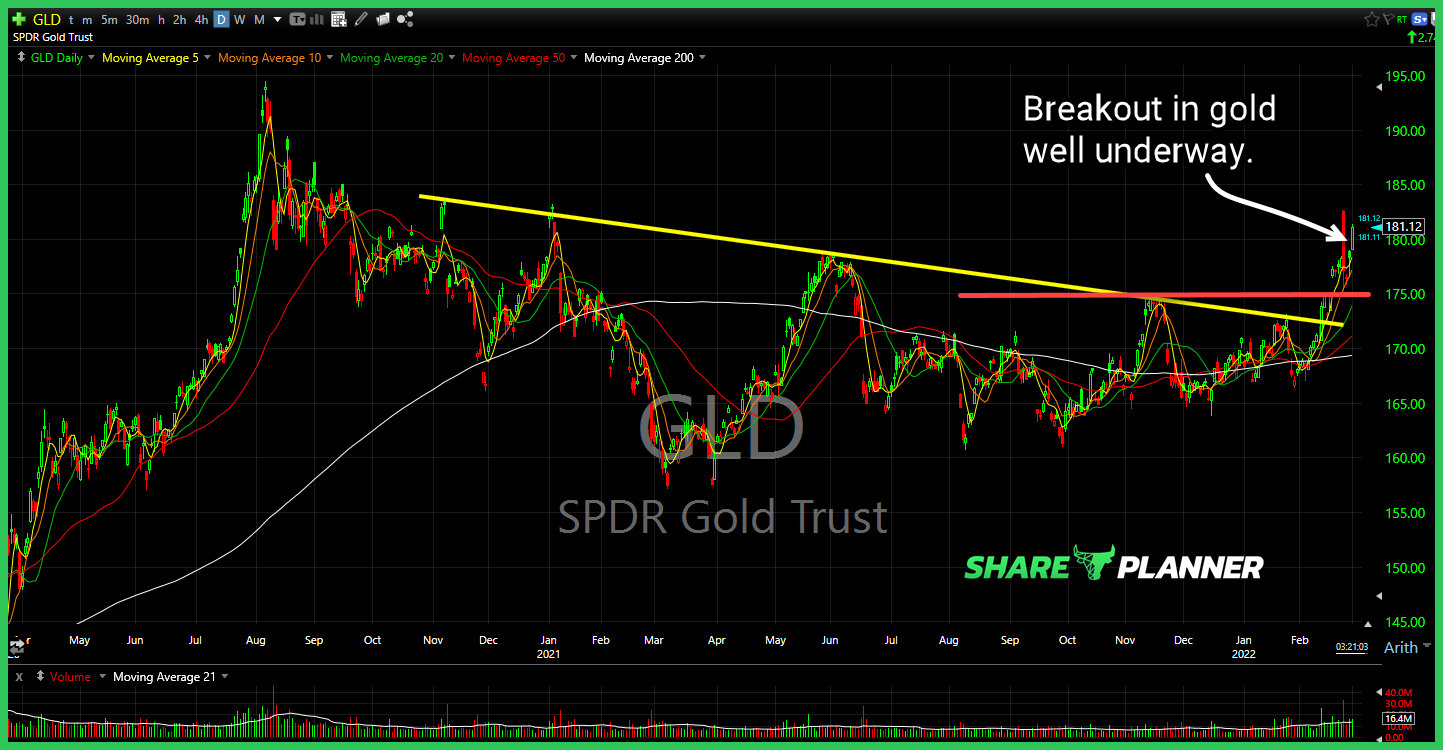
Unlike $SLV, the $GLD breakout has been well underway.

spc@shareplanner.com
(904) 800-8420
© Copyright 2025 | SharePlanner Inc. All Rights Reserved.
Disclaimer: The information provided on this website is for educational and informational purposes only. Ryan Mallory and/or SharePlanner are not licensed financial advisors, brokers, or tax professionals. The content on this site should not be considered as financial, investment, tax, or legal advice.
All information and opinions expressed herein are based on sources believed to be accurate and reliable. However, we make no representation or warranty as to their accuracy, completeness, or reliability. Any action you take upon the information on this website is strictly at your own risk.
Past performance is not indicative of future results. Investing involves risk, including the possible loss of principal. All investors should make their own decisions based on their specific investment objectives and financial circumstances.
This site may contain links to external websites that are not provided or maintained by or in any way affiliated with Ryan Mallory and/or SharePlanner. Please note that Ryan Mallory and/or SharePlanner do not guarantee the accuracy, relevance, timeliness, or completeness of any information on these external websites.
By using this website, you agree that Ryan Mallory and/or SharePlanner and any affiliated parties are not responsible for any losses or damages resulting from your use of or reliance on the information provided.
It is strongly recommended that you consult with a qualified professional before making any financial decisions.